Become a MacRumors Supporter for $50/year with no ads, ability to filter front page stories, and private forums.

thrill4rishabh

macrumors newbie
Original poster
Jul 17, 2012
26
0
Hi, have been using Xcode for about a year now and am having some problems with the debugging environment.

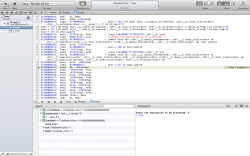
I have finally started to learn debugging in Xcode, and have gone through numerous tutorials, crash courses, etc. but my problem is, when I set a breakpoint, and run the program, the debug navigator opens up and the Thread opens up showing a bunch of numbers and commands that make no sense to me.

Is there a way to step through the code and watch the variables step by step and do it on the source code?

I'll post a picture if this doesn't make sense.
 

Attachments

  • Screen Shot 2013-11-19 at 2.24.18 AM.png
    Screen Shot 2013-11-19 at 2.24.18 AM.png
    232.5 KB · Views: 237

szymczyk

macrumors regular
Mar 5, 2006
187
17
Is there a way to step through the code and watch the variables step by step and do it on the source code?
In your screenshot, the program got to the point where the user was prompted to enter the expression to be processed. Set a breakpoint at that line of code.

Now when you run the program, it should stop where you set the breakpoint. At this point you can step through the code. Above the variables list in your screen shot are a series of buttons. Use the rightmost three buttons to step through the code. From left to right, the buttons are Step Over, Step Into, and Step Out.

If Xcode stops before reaching the breakpoint, set a breakpoint at the first line of code in your program. If Xcode doesn't reach that breakpoint, you're in trouble.

The most likely reason you can't step through the code in your screenshot is that there's an error in your code. The problem is occurring at a lower level than your source code, which is why the editor is showing a bunch of assembly language instead of your source code.
 

thrill4rishabh

macrumors newbie
Original poster
Jul 17, 2012
26
0
The most likely reason you can't step through the code in your screenshot is that there's an error in your code. The problem is occurring at a lower level than your source code, which is why the editor is showing a bunch of assembly language instead of your source code.

I get that. But what do I do about it?
Without breakpoints the code compiles and runs but doesn't work as required. So there isn't any syntax error.

Thanks
 

szymczyk

macrumors regular
Mar 5, 2006
187
17
What to do about it? Fix your code. You haven't provided enough information for anyone to provide any additional help.

Use the debugger to figure out where the error is occurring in your code. In my previous post I provided options on where to place the breakpoints in your code.
 

thrill4rishabh

macrumors newbie
Original poster
Jul 17, 2012
26
0
What to do about it? Fix your code. You haven't provided enough information for anyone to provide any additional help.

Use the debugger to figure out where the error is occurring in your code. In my previous post I provided options on where to place the breakpoints in your code.

I'm sorry I tried. I even tried debugging programs that work completely fine and I still get the assembly language every time I run it with a breakpoint. Are you sure there isn't anything in the settings or preferences I can tweek?
 

szymczyk

macrumors regular
Mar 5, 2006
187
17
Is Xcode stopping at the breakpoints you set? If the answer is No, click the Breakpoints button in the project window toolbar. The Breakpoints button toggles running and debugging your project.

If Xcode is stopping at your breakpoints and you're getting assembly language, make sure you're using the Debug build configuration. There's a Scheme menu in the project window toolbar. Click it and choose Edit Scheme to open the scheme editor. Select the Run step from the left side of the scheme editor. From there you should be able to choose the build configuration to use.

Another suggestion I can make is to upgrade to Xcode 5 and see if that improves your debugging experience.
 

thrill4rishabh

macrumors newbie
Original poster
Jul 17, 2012
26
0
Is Xcode stopping at the breakpoints you set? If the answer is No, click the Breakpoints button in the project window toolbar. The Breakpoints button toggles running and debugging your project.

If Xcode is stopping at your breakpoints and you're getting assembly language, make sure you're using the Debug build configuration. There's a Scheme menu in the project window toolbar. Click it and choose Edit Scheme to open the scheme editor. Select the Run step from the left side of the scheme editor. From there you should be able to choose the build configuration to use.

Another suggestion I can make is to upgrade to Xcode 5 and see if that improves your debugging experience.

Yes It does stop at the breakpoints and i get assembly language. But I'm already using Debug build configuration.

On upgrading to Xcode 5, I'm still using Lion and you can't get Xcode 5 unless you upgrade to Mavericks.
 

szymczyk

macrumors regular
Mar 5, 2006
187
17
I have no idea what is causing the assembly language problem. Other than reinstalling Xcode, I have nothing else to suggest.

Mavericks is free. Unless you have an Intel Mac that is incapable of running Mountain Lion, which are mostly 5-7 year old Macs, you can upgrade to Mavericks and use Xcode 5.
 

thrill4rishabh

macrumors newbie
Original poster
Jul 17, 2012
26
0
I have no idea what is causing the assembly language problem. Other than reinstalling Xcode, I have nothing else to suggest.

Mavericks is free. Unless you have an Intel Mac that is incapable of running Mountain Lion, which are mostly 5-7 year old Macs, you can upgrade to Mavericks and use Xcode 5.

Yup I did that. Got Xcode 5. Still getting the assembly language though. You think reinstalling would solve that?
 

chown33

Moderator
Staff member
Aug 9, 2009
10,750
8,422
A sea of green
Yup I did that. Got Xcode 5. Still getting the assembly language though. You think reinstalling would solve that?

Hard to predict, you'd have to try it.

Reinstalling won't change any existing Xcode preferences or settings, however, and it's possible they are a factor. To examine this possibility:
  1. Create a new non-admin user account.
  2. Login or fast-user-switch to that account.
  3. Launch Xcode (you may need to add the new user to the developer group).
  4. Create a new project, with the same template you're having problems with.
  5. Add enough code that you can set breakpoints.
  6. Compile it to make sure it compiles.
  7. Set breakpoints.
  8. Debug it.
  9. What appears when the breakpoint is hit?
 

cbreak

macrumors member
Mar 22, 2008
42
0
In the Debug Menu, chose Debug Workflow and make sure "Show Disassembly when debugging" is not enabled.
In your scheme, make sure you are in debug mode.
Make sure the code you try to debug has symbols, i.e. is not a library that is compiled without.
 
Register on MacRumors! This sidebar will go away, and you'll see fewer ads.