Become a MacRumors Supporter for $50/year with no ads, ability to filter front page stories, and private forums.

alexandre16

macrumors member
Original poster
Jan 21, 2011
72
0
Hi developers.

I am using xcode to build some simples command line programs, and now i want to check where is the value that i insert to a variable, i am writing in C language.

Exemple:

scanf("%d", &Var);

well, i run the program and insert the value, then i pause the program executation and go to Product -> Debug -> View memory and then i dont know what address i need to choose to see my value of the variable, anyone can give me some help with that?

Thanks people.
 

jared_kipe

macrumors 68030
Dec 8, 2003
2,967
1
Seattle
You should just set a breakpoint at that line, step over it, and in the debugger you will see the new value for 'Var'.

You could obviously printf out the variable, and its address (&Var) too.
 

alexandre16

macrumors member
Original poster
Jan 21, 2011
72
0
You should just set a breakpoint at that line, step over it, and in the debugger you will see the new value for 'Var'.

You could obviously printf out the variable, and its address (&Var) too.

Yes i am using the breakpoint but my problem is to find the right address of the variable, because i only want to know in the memory, where is the value of my variable, and i will see it using the address, and then put this address in Product -> Debug -> View memory, i put the code and see some hexadecimals codes and the correspondent value of this hexadecimal codes, but i dont see the value that i put in my variable...maybe because the address that i use isnt the right address.

How can i get the right address of my variable?

Thanks for the answer
 

mfram

Contributor
Jan 23, 2010
1,307
343
San Diego, CA USA
Is your variable on the variable list? If so, select it. Right click. One of the options is View Memory of "Var". It will bring up the memory viewer at the correct location.

Otherwise, you can print it out with printf.

Code:
printf("%p\n", &Var);

Put the value into the memory viewer.
 

alexandre16

macrumors member
Original poster
Jan 21, 2011
72
0
Is your variable on the variable list? If so, select it. Right click. One of the options is View Memory of "Var". It will bring up the memory viewer at the correct location.

Otherwise, you can print it out with printf.

Code:
printf("%p\n", &Var);

Put the value into the memory viewer.

it is the problem, my var isnt in the list...

i am using this program...


Code:
#include <stdio.h>

int seconds_from_time(int h, int m, int d)
{
    return( h * 3600 + m * 60 + d);
}

void exercise_1_1 (void)
{
    int h;
    int m;
    int d;
    while (scanf ("%d%d%d", &h, &m, &d) != EOF)
    {
        int z = seconds_from_time (h, m, d);
        printf ("%d\n", z);
    }
}

int main()
{
    exercise_1_1();
    return 0;
}
 
Last edited by a moderator:

gnasher729

Suspended
Nov 25, 2005
17,980
5,565
Yes i am using the breakpoint but my problem is to find the right address of the variable, because i only want to know in the memory, where is the value of my variable, and i will see it using the address, and then put this address in Product -> Debug -> View memory, i put the code and see some hexadecimals codes and the correspondent value of this hexadecimal codes, but i dont see the value that i put in my variable...maybe because the address that i use isnt the right address.

How can i get the right address of my variable?

Thanks for the answer

You are trying to make this very, very painful for yourself. Trying to use "View memory" to see the contents of a variable is just daft. Set a breakpoint where the variable is read. Run the program. When Xcode stops at the breakpoint, there is a view at the bottom of the Xcode window showing you all the variables of that function with their values.

"Pause" isn't very helpful because by the time you press "Pause" your program has been running on executing about 2 billion instructions per second, so you can probably see on the left side in the call stack that it is in the middle of the scanf function, waiting for your input. Use a breakpoint.
 

alexandre16

macrumors member
Original poster
Jan 21, 2011
72
0
Which versions of Mac OS and Xcode are you running?

I am using the last version of OSX and Xcode.

i am using the lldb debugger.

i am using the breakpoint at the line of scanf, using the code that i posted above, when i run the the code and it stop at the breakpoint i have 3 things in the debugger navigation, exercise_1_1, main and start.

What i am doing wrong?
 

lloyddean

macrumors 65816
May 10, 2009
1,047
19
Des Moines, WA
That's the "stack trace" pane off to the left side of the "source" pane.

So that's a big "no" on my question.

At the top right of the window above the "source" pane is a collection of buttons. One of which is called "View". Select the center button. A "debug" pane should appear "BELOW" your projects source.

All the above is accurate assuming you haven't done any custom setup.
 

firewood

macrumors G3
Jul 29, 2003
8,108
1,345
Silicon Valley
To find the address of variable foo, you can just type:

Code:
print &foo
in Xcode's debug console, after hitting some breakpoint or stopping the app with that variable in scope. Then you can use:

Code:
me r -b <start_address> <end_address>
to dump out hex bytes at that (or any other nearby) address.
 

gnasher729

Suspended
Nov 25, 2005
17,980
5,565
I am using the last version of OSX and Xcode.

i am using the lldb debugger.

i am using the breakpoint at the line of scanf, using the code that i posted above, when i run the the code and it stop at the breakpoint i have 3 things in the debugger navigation, exercise_1_1, main and start.

What i am doing wrong?

What you are doing wrong is that you haven't learned what all the little clickety icons on the screen are there for and what all the menu items are doing.

Can you tell us what the "Show Toolbar" or "Hide Toolbar" menu does? That's the first step. Next, what do the three icons with "View" under them do? That's the next step. What do the three little icons to the right of the "Clear" button do?
 

alexandre16

macrumors member
Original poster
Jan 21, 2011
72
0
What you are doing wrong is that you haven't learned what all the little clickety icons on the screen are there for and what all the menu items are doing.

Can you tell us what the "Show Toolbar" or "Hide Toolbar" menu does? That's the first step. Next, what do the three icons with "View" under them do? That's the next step. What do the three little icons to the right of the "Clear" button do?

i am not an expert in xcode because i start using it maybe 1 month ago, but until this problem everything is ok, anyone can talk with me by skype? it will resolve the problem in 1 minute because i can show you some pictures....

Thanks
 

lloyddean

macrumors 65816
May 10, 2009
1,047
19
Des Moines, WA
Why Skype when there a native solutions already a part of your "last version of OSX" - Messages.

What you haven't clearly made apparent yet is if you've got it figured out yet or not!
 

alexandre16

macrumors member
Original poster
Jan 21, 2011
72
0
Why Skype when there a native solutions already a part of your "last version of OSX" - Messages.

What you haven't clearly made apparent yet is if you've got it figured out yet or not!

Yeh i can use messages, anyone can help?
 

ramy1989

macrumors newbie
Nov 7, 2012
21
0
About printing the variable address, other than printf you can do it with gdb: "print &Var".
 

lloyddean

macrumors 65816
May 10, 2009
1,047
19
Des Moines, WA
Are we both speaking english or is it just me.

I see your variables "below" the "source pane" in that image.

Perhaps you could say explicitly what it is you need to see that isn't in that image.

If you're looking for the addresses of 'argc', 'argv' and 'retVal' then 'argc' and 'argv' will most likely be in 'registers', which don't have an address and 'retVal' may've been mapped directly to the 'register' in which function results are returned bypassing the stack altogether.
 

alexandre16

macrumors member
Original poster
Jan 21, 2011
72
0
Are we both speaking english or is it just me.

I see your variables "below" the "source pane" in that image.

Perhaps you could say explicitly what it is you need to see that isn't in that image.

If you're looking for the addresses of 'argc', 'argv' and 'retVal' then 'argc' and 'argv' will most likely be in 'registers', which don't have an address and 'retVal' may've been mapped directly to the 'register' in which function results are returned bypassing the stack altogether.

this image is not mine, i said if i have this image it will be easy to find the values of variables in the stack strace, but i dont have this.

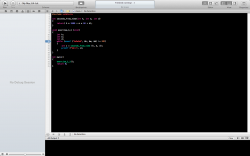
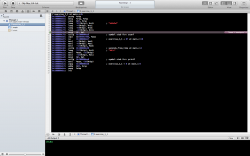
I posted a simple code above, and i want to share a simple image to show you, what i have in my xcode.

Can i send you a image via email, or other way?
 

alexandre16

macrumors member
Original poster
Jan 21, 2011
72
0

Attachments

  • Captura de ecrã 2012-11-18, às 17.16.17.png
    Captura de ecrã 2012-11-18, às 17.16.17.png
    122.1 KB · Views: 280
  • Captura de ecrã 2012-11-18, às 17.16.34.png
    Captura de ecrã 2012-11-18, às 17.16.34.png
    199.5 KB · Views: 253

lloyddean

macrumors 65816
May 10, 2009
1,047
19
Des Moines, WA
The picture helps.

In the "debug pane" you're only displaying the "console".

See the "clear" button in the "debug pane"? Their's a group of three buttons next to it. Press the center button and your variables sub pane will display what you're wanting to see.
 
Register on MacRumors! This sidebar will go away, and you'll see fewer ads.