Just purchased iStats 4 - looks very nice however temperature reading on menu bar has went from an average of 35 to around 75.
75ºC is fairly normal for a CPU Die temperature sensor, while things are being done (Safari can be fairly demanding).
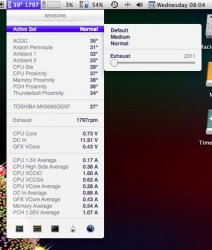
Is the default sensor reading in iStats 4 'CPU Die - Digital' the same as in iStats 3??
What was the name of the sensor in iStat Menus 3? Maybe it was a CPU proximity sensor you're comparing to? I believe the die sensors are located in the CPU and the proximity sensors are nearby, so the proximity ones are typically lower.
Do not "Update" to version 4 unless you're absolutely certain you want to keep it and pay for it. If you install it, then decide to go back to version 3, you'll have quite a mess on your hands. The icons from version 4 will remain, but you won't be able to access them because they now link to the version 3 preference menu you reinstalled.
This shouldn't be the case at all. Did you uninstall iStat Menus 4 before reinstalling iStat Menus 3? Due to the nature of the app, there's a lot of moving parts in the background, so you can't just drag the app itself to the trash.
I have to agree that if an upgrade requires a new licence (money) then it should be clearly stated, and provision made to stay at the current release without being bombarded with new upgrade notifications.
We could have definitely made it more clear (lesson learned), but there is a button that can be used to skip the update (Skip This Version), plus a way to disable update checking completely, if you'd like to do so.
I was quite annoyed to find that having installed the upgrade I had to pay to use it, and apparently no ability to roll back to the previous version.
If you'd like to revert to iStat Menus 3, please uninstall iStat Menus 4 and reinstall iStat Menus 3.
I am used to looking at the battery widget to see what the current consumption is. That has now moved under the "Sensors" widget - which displays temperature ... a bit odd to click on temp to see current consumption.
Battery usage should be under the battery menubar item (configurable from the Battery tab within iStat Menus).
Would be nice to suppress all the silly "progress bars") or whatever they are called and just display the value as a number (Hint: If I wanted an iPad, I would BUY an iPad, I REALLY don't want my laptop to look feel or behave like an iPad).
Which bars are you talking about? They may be able to be changed.
I saw the notification about it being a paid update very clearly, and held off on it. Since I don't use a "retina" display and didn't see any compelling features in version 4 over version 3, I figured I'd just stick with it. However, the upgrade pricing was low and I use this app (as well as the out-of-support Dashboard app) many times each day, so I figured I'd do my part to support the developers. I upgraded to version 4 yesterday.
Thank you very much. We appreciate it.
It's not a critical thing, but for some reason iStat shows up under the system items. It would be nice if it showed up under the "active menu items," instead. I assume this has something to do with how iStat Menus is designating itself, but it may be an issue on Bartender's end. If it's intentional, that's OK - I just figured I'd mention it.
This is because iStat Menus uses NSMenuExtra, rather than NSStatusItem. NSStatusItem is the method Apple want third party developers to use (and the only method acceptable for the Mac App Store), but NSMenuExtra items have many advantages, like the ability to be reordered and placed just to the left of the Spotlight icon. For iStat Menus, those two features are essential. So, unfortunately, it's unlikely we'd change. Maybe there's something the Bartender guys could change at their end.
Regardless of my personal preferences, I'd also like to say "thank you" to the developers for working on this application. It's very useful.
Thanks. We're a tiny company, but we work hard. I hope it shows.
----------
WTF the menu bar for HDD suddenly shows 0 for used/free?
Can you please check to see if you have a disk added to the Menubar Disks area? This will determine which disk(s) are shown in the menubar.
Is this a bug where the history graphs show the wrong peak values?
The values in the history graphs are averages of time periods in question. This will smooth out spikes, but also give a better indication of what happened within that period.
Finally, with the history graphs, can you link the lines (i.e. bridge the gaps) when the machine is asleep/restarted? I don't know how this would look but I've got large 12 hour gaps which make the graphs look, abit silly.
Showing a gap is probably the more true and correct way to represent the data though.
")