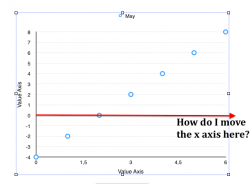
This may be a basic question, but I´m having trouble editing a chart in pages. By default, the x axis seems to be stuck at the bottom of the chart, but I want it to be in the position of the red line on the image below. I´m sure its just me missing something obvious, but can someone point me in the right direction. Thanks!
Got a tip for us?
Let us know
Become a MacRumors Supporter for $50/year with no ads, ability to filter front page stories, and private forums.
Editing Charts in Pages
- Thread starter .Pete.
- Start date
- Sort by reaction score