Become a MacRumors Supporter for $50/year with no ads, ability to filter front page stories, and private forums.

Darkroom

Guest
Original poster
Dec 15, 2006
2,445
0
Montréal, Canada
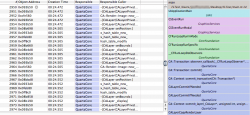
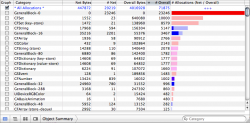
in testing my app for memory leaks and object allocation, i've noticed that my "GeneralBlock-0" seems to only grow, and quickly turn to and maintain ominous red, while the other bars grow and shrink...

i don't really understand Instruments that well, so is this a bad thing?
 

Attachments

  • Picture 3.png
    Picture 3.png
    87.2 KB · Views: 90

kpua

macrumors 6502
Jul 25, 2006
294
0
Looks like you're mallocing a lot of zero-length buffers. An odd thing to do. Try looking at one of the stack traces to see where you're doing it.
 

Darkroom

Guest
Original poster
Dec 15, 2006
2,445
0
Montréal, Canada
Looks like you're mallocing a lot of zero-length buffers. An odd thing to do. Try looking at one of the stack traces to see where you're doing it.

i'm sorry, but what? i don't know what you are telling me :eek: i gather that this is a problem, then?
 

kpua

macrumors 6502
Jul 25, 2006
294
0
Your program is doing essentially this very often:

Code:
malloc( 0 )

which allocates 0 bytes. This probably isn't really free... The malloc system probably still does the book-keeping for these allocations, which still takes space.


To figure out where this is happening, click the little arrow next to GeneralBlock-0. Click on one of the entries in the "Object Address" column and then click the button at the bottom that shows the sidebar. This shows the stack trace for the allocation. That will show you where you program is doing this funny allocation. (I'd suggest looking at several of these to make sure the location is the same each time.)
 

Darkroom

Guest
Original poster
Dec 15, 2006
2,445
0
Montréal, Canada
Your program is doing essentially this very often:

Code:
malloc( 0 )

which allocates 0 bytes. This probably isn't really free... The malloc system probably still does the book-keeping for these allocations, which still takes space.


To figure out where this is happening, click the little arrow next to GeneralBlock-0. Click on one of the entries in the "Object Address" column and then click the button at the bottom that shows the sidebar. This shows the stack trace for the allocation. That will show you where you program is doing this funny allocation. (I'd suggest looking at several of these to make sure the location is the same each time.)

humm... ok, so it appears from the stack trace that this is happening in my main.m file, on line 14 (from stack trace = appAddress/main.m:14)

i didn't change this file at all... it's the main.m that was automatically included when choosing a View-Based Application template. i know this is not an iPhone Development forum, but i posted here because my concern is with Instruments.

Code:
#import <UIKit/UIKit.h>

int main(int argc, char *argv[]) {
    
    NSAutoreleasePool * pool = [[NSAutoreleasePool alloc] init];
    [B]int retVal = UIApplicationMain(argc, argv, nil, nil);[/B] [COLOR="Green"]//Line 14[/COLOR]
    [pool release];
    return retVal;
}

or maybe it's related to Quartz Core and Core Graphics Framework? what should i do?
 

Attachments

  • Picture-2.png
    Picture-2.png
    40.9 KB · Views: 70

kpua

macrumors 6502
Jul 25, 2006
294
0
main() is the "bottom" of the stack trace, giving the least amount of information because it calls everything else. You need to show the "top" of the stack by scrolling down in the stack trace window.
 

Darkroom

Guest
Original poster
Dec 15, 2006
2,445
0
Montréal, Canada
i've attached this sample project which does the same thing... if you could take a lot at it and tell me what the problem is that would be great. it appears that my error is with using the core graphic framework, or something... perhaps i've set it up incorrectly? not releasing something, maybe?

[EDIT] it seems like the OP in this thread is experiencing the same problem. is this a bug in simulator? or is it really slowing down my app for real?
 

Attachments

  • SubViewRotation.zip
    25.2 KB · Views: 78

Darkroom

Guest
Original poster
Dec 15, 2006
2,445
0
Montréal, Canada
Bug with iPhone Simulator

this seems to only happen in the iPhone Simulator, as the same thing didn't occur while using instruments for on-device testing.
 
Register on MacRumors! This sidebar will go away, and you'll see fewer ads.