Become a MacRumors Supporter for $50/year with no ads, ability to filter front page stories, and private forums.

ghanwani

macrumors 601
Original poster
Dec 8, 2008
4,625
5,809
Came across this tweet today

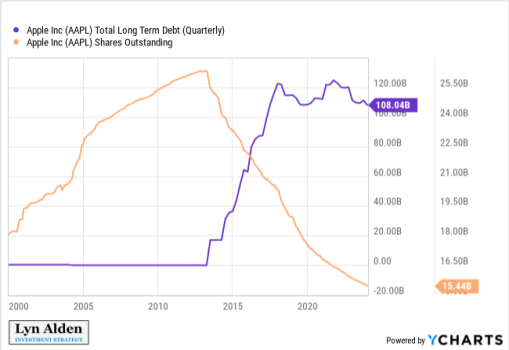
Beautifully demonstrates Apple’s financial engineering in one chart.

If you look at Apple stock price, the time they started this circus is when the stock price took off.

Also note the circus started after Jobs.
 

Attachments

  • IMG_1953.png
    IMG_1953.png
    45.1 KB · Views: 59
  • Like
Reactions: T'hain Esh Kelch

ghanwani

macrumors 601
Original poster
Dec 8, 2008
4,625
5,809
There’s a detailed explanation in the article linked within the tweet.

Essentially, they started using leverage which is taking on long term debt and using that to buy back stock (which reduces the number of outstanding shares in the market). This increases earnings per share without an actual increase in total earnings which allowed the stock to appreciate without any substantial earnings growth.
 

JustAnExpat

macrumors 6502a
Nov 27, 2019
938
965
There’s a detailed explanation in the article linked within the tweet.

Essentially, they started using leverage which is taking on long term debt and using that to buy back stock (which reduces the number of outstanding shares in the market). This increases earnings per share without an actual increase in total earnings which allowed the stock to appreciate without any substantial earnings growth.
But Apple's earnings have been growing.

https://www.apple.com/newsroom/2024/02/apple-reports-first-quarter-results/

Are you saying they are lying to the government?
 

ghanwani

macrumors 601
Original poster
Dec 8, 2008
4,625
5,809
But Apple's earnings have been growing.

https://www.apple.com/newsroom/2024/02/apple-reports-first-quarter-results/

Are you saying they are lying to the government?
Look at the green bars in the attached chart. Aside from the most recent quarter, their net earnings have been more or less flat for the last several years. Earnings per share has been going up because number of shares is going down.

(Chart from https://applescoop.org/story/apple-reports-record-breaking-q1-2021-earnings)
 

Attachments

  • IMG_1956.jpeg
    IMG_1956.jpeg
    100.7 KB · Views: 32

dmccloud

macrumors 68030
Sep 7, 2009
2,990
1,727
Anchorage, AK
Look at the green bars in the attached chart. Aside from the most recent quarter, their net earnings have been more or less flat for the last several years. Earnings per share has been going up because number of shares is going down.

(Chart from https://applescoop.org/story/apple-reports-record-breaking-q1-2021-earnings)

That chart ends in Q1 2021 - that's not even remotely the most recent quarter. In fact, the chart in the first post in this thread also ends in 2021, yet the author of that chart misrepresents that as current (2024) data to drive people to her website and services. Sorry, but using information with a cutoff date of three years ago and ignoring everything since does NOT equate to accurate analysis, and opens one up to questions regarding the motivations behind such selective analysis.
 
Register on MacRumors! This sidebar will go away, and you'll see fewer ads.