This is a repost of a reply which I made in another thread. Since I suspect a number of people might use hard disks thought seeing vendor failure rates would be useful.
Backblaze's most recent report of drive failure rates over a billion hour time usage period and 61,590 drives was just updated yesterday.
https://www.backblaze.com/blog/hard-drive-reliability-stats-q1-2016/
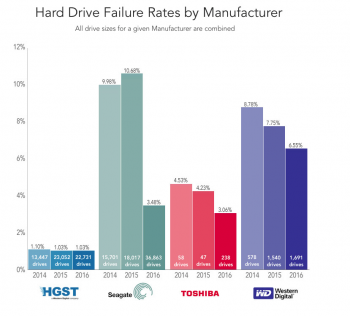
See the first graph below for the 2016 results.
They reported the lowest annual failure rate they have experienced at 1.84%.
Seagate and Western Digital have the highest cumulative (since 2013) failure rates. HGST has the lowest, Toshiba is in the middle. For 2016 their failure rates have been (10.68%), (6.55%), (1.03%), and (3.06%) respectively.
Larger drives (6 and 8 TB) are getting closer in price (per TB) to the 4 TB drives they generally use.
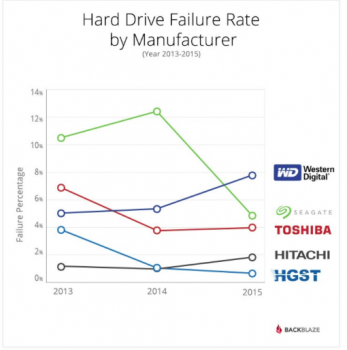
The second graph comes from Ross Lazarus, "a self-described grumpy computational biologist". He analyzed the data using Kaplan-Meier statistics and plots. Data is through 2015 only. (http://bioinformare.blogspot.com.au/2016/02/survival-analysis-of-hard-disk-drive.html).
Backblaze's most recent report of drive failure rates over a billion hour time usage period and 61,590 drives was just updated yesterday.
https://www.backblaze.com/blog/hard-drive-reliability-stats-q1-2016/
See the first graph below for the 2016 results.
They reported the lowest annual failure rate they have experienced at 1.84%.
Seagate and Western Digital have the highest cumulative (since 2013) failure rates. HGST has the lowest, Toshiba is in the middle. For 2016 their failure rates have been (10.68%), (6.55%), (1.03%), and (3.06%) respectively.
Larger drives (6 and 8 TB) are getting closer in price (per TB) to the 4 TB drives they generally use.
The second graph comes from Ross Lazarus, "a self-described grumpy computational biologist". He analyzed the data using Kaplan-Meier statistics and plots. Data is through 2015 only. (http://bioinformare.blogspot.com.au/2016/02/survival-analysis-of-hard-disk-drive.html).