The awesome MacRumors Forums community taught me in this thread how to tally numbers when an adjacent cell in the matched a certain number using the SUMIF() function.
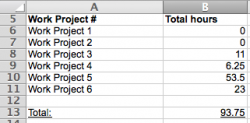
In my included screenshots, you can see that I input the number of hours my team works on different projects with the date, and then the SUMIF() function conveniently gives me the total number of hours worked per project.
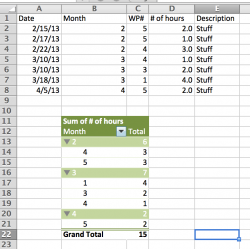
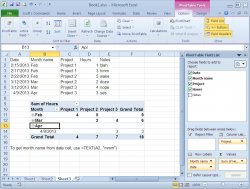
I'm wondering how to extend this so that they can also be tallied by month. Because I often input project numbers and dates well after they've happened, they're not in chronological order and I'm constantly adding old information. Is there a way to have Excel break down the total number of hours worked per project per month?
Let me know if I can provide any further information to clarify. Thanks for the help!
In my included screenshots, you can see that I input the number of hours my team works on different projects with the date, and then the SUMIF() function conveniently gives me the total number of hours worked per project.
I'm wondering how to extend this so that they can also be tallied by month. Because I often input project numbers and dates well after they've happened, they're not in chronological order and I'm constantly adding old information. Is there a way to have Excel break down the total number of hours worked per project per month?
Let me know if I can provide any further information to clarify. Thanks for the help!
Attachments

Last edited: