Hi,
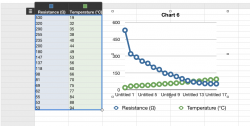
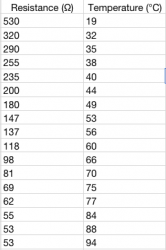
Although I'm a long time Mac user, I've never really used Numbers. I want to plot a graph to show the correlation between two sets of data: resistance and temperature. However, I keep getting two lines rather than the one I desire!
Any help?
Although I'm a long time Mac user, I've never really used Numbers. I want to plot a graph to show the correlation between two sets of data: resistance and temperature. However, I keep getting two lines rather than the one I desire!
Any help?