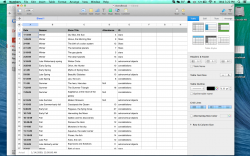
I have a spreadsheet (see below) and I'm trying to chart the data. I'd like the dates/show titles to be on the X asis and the attendance to be on the Y axis. This is my first time using numbers so I'm unsure how to do this.
Could use some help with this.
Thanks!
Could use some help with this.
Thanks!