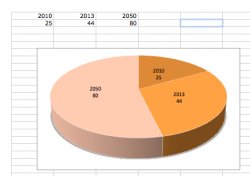
So I'm creating a chart to show Uk carbon emission targets. I realise that the total percentage will not equal 100% but that's not the point of the chart...
Although the data is correct, the figures on the chart itself is not correct. Is there a way that I can override the figures on the chart? If not, how can I make it match the table data but ignore the 100% rule?
Thank You
Although the data is correct, the figures on the chart itself is not correct. Is there a way that I can override the figures on the chart? If not, how can I make it match the table data but ignore the 100% rule?
Thank You