Hi, Can someone please help me with this problem..I'm already getting fedup thinking of not using iwork ever again.
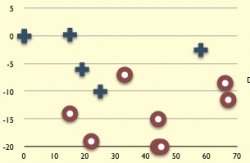
I'm trying to do a scatter chart with the following results
58 -2.5 33 -7
15 0.25 15 -14
19 -6 67 -11.5
25 -10 44 -20
45 -20
44 -15
66 -8.5
22 -19
The chart however for some reason plots an extra point at 0/0. This problem doesn't happen when using numbers but if i drag the chart to keynote , keynote adds this extra point. Tried every possible solution i can think of with no success.
Can someone pleaaaaaaase help! Thank you.