Become a MacRumors Supporter for $50/year with no ads, ability to filter front page stories, and private forums.

AndyMoore

macrumors 6502
Original poster
Feb 8, 2008
307
4
Strange one this that I've just noticed.

My iMac has 4Gb RAM and this morning I had a problem with the blued process chewing up memory even though Bluetooth was off and I don't ever use it. After a bit of searching I found the probable cause.

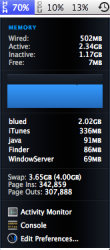
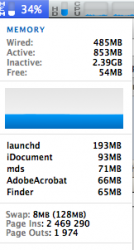
Anyway, whilst looking at the above issue, my system was really crawling but the memory usage wasn't over 70% and CPU usage was low too. The swap space usage had jumped up to 4Gb and all the time I was opening new Safari windows researching the issue. The system was getting more and more sluggish and the swap usage was growing but memory usage stayed at 70%.

Why wouldn't it use the last 30%?
 

Attachments

  • Screen shot 2010-03-20 at 08.43.27.png
    Screen shot 2010-03-20 at 08.43.27.png
    67.9 KB · Views: 98
If you're system is crawling, why not reboot to see if that resolves it
 
Sorry, I wasn't too clear on that. I quit the blued process and got the 2Gb it was using back and the system was fine again.

My question was really why the memory usage wouldn't go above 70% and instead each new process grabbed a load of virtual memory / swap space. Didn't matter what else I opened, it was obviously impacting performance but it had over 1Gb free (30% of 4Gb) but wouldn't use it.
 
i think since blued is going haywire, it's not properly using the available memory and skipped straight to swapping. did a google and found that others have reported the same issue.
 
i think since blued is going haywire, it's not properly using the available memory and skipped straight to swapping. did a google and found that others have reported the same issue.

Actually tread starters RAM is used to the max. only 7 MB free.

It is just the inactive part that make it report only 70% usage. so reported usage is only calculated from RAM in active usage.

The inactive part is "in use" but available if needed.

here look at mine
 

Attachments

  • Screen shot 2010-03-21 at 01.38.35.png
    Screen shot 2010-03-21 at 01.38.35.png
    27.1 KB · Views: 263
  • Screen shot 2010-03-21 at 02.18.33.png
    Screen shot 2010-03-21 at 02.18.33.png
    1.1 MB · Views: 88
Try correlating process memory usage against 32 or 64 bits - 32 bit processes can only use ~3.3GB of memory each. My guess is it's something to do with that.

Beyond that, try running Onyx. You never know what garbage is there causing problems.
 
Actually tread starters RAM is used to the max. only 7 MB free.

It is just the inactive part that make it report only 70% usage. so reported usage is only calculated from RAM in active usage.

The inactive part is "in use" but available if needed.

It needed the inactive memory because it was swapping so much but it didn't use it. It's very strange.

I'm going to try some other processes to see if I can get my memory usage above 70%.

P.S. That's a nightmare of a Dock you've got there ;)
 
I just did an unscientific experiment whereby I opened up around 130 Safari pages, Mail, iTunes, iCal, iPhoto, GarageBand, iMovie, X-Plane, THe Hit List and Activity Monitor.

Memory usage peaked at 75% but then dropped down to 73%. The system was really sluggish again so I think that it must be the way that the memory usage is reported in MenuMeters.
 
It needed the inactive memory because it was swapping so much but it didn't use it. It's very strange.

I'm going to try some other processes to see if I can get my memory usage above 70%.

P.S. That's a nightmare of a Dock you've got there ;)

you are right but the same happened for me. I think there is something we don't understand about the memory process.


hehe the dock was crazy.... took me a whole 2 minutes to get every thing back to normal with only 19 icons in the dock.
Opening all programs at ones is not a good idea.

But when all apps had opened there was no "slugginess" for me.
 
I'm actually having a similar/strange situation with my RAM. (I posted my problem here but no one really looked at it much so I guessed I could join you guys.)

I only have Finder, Firefox, iTunes, Evernote, Speed Download Lite, Adium and Dictionary open yet I only have 52MB of RAM out of my 2GB left. No idea what is using all of it.

33c6xjc.jpg
 
Since some of you are iStat Menus users:

In the iStat preferences under "Memory" is an option labeled "Show inactive as free."

I had the same issue with the box checked, but when I unchecked it my memory usage was displayed as 99%.

This (old) article explains 'inactive memory as follows:

http://support.apple.com/kb/ht1342

Inactive memory

This information in memory is not actively being used, but was recently used.

For example, if you've been using Mail and then quit it, the RAM that Mail was using is marked as Inactive memory. This Inactive memory is available for use by another application, just like Free memory. However, if you open Mail before its Inactive memory is used by a different application, Mail will open quicker because its Inactive memory is converted to Active memory, instead of loading Mail from the slower hard disk.​

I still don't quite understand why my active and wired memory would peg at 70%, or what this means for performance, but it's more info.
 
Register on MacRumors! This sidebar will go away, and you'll see fewer ads.