Become a MacRumors Supporter for $50/year with no ads, ability to filter front page stories, and private forums.

Traverse

macrumors 604
Original poster
Mar 11, 2013
7,720
4,505
Here
Activity Monitor by default shows a "memory" column. I always thought that it's numbers seem a bit low.

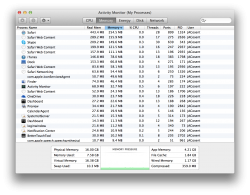
I just discovered on Macrumors (thanks W0lf) that there is another column called "real memory" that uses like 2x as much in some instances (see screenshot).

Which one is actual usage? What's the difference?

Also what is "private memory" which is another option.

Thanks, I'm just trying to learn more about computers.
 

Attachments

  • Screen Shot 2014-06-28 at 11.10.04 PM.png
    Screen Shot 2014-06-28 at 11.10.04 PM.png
    573 KB · Views: 3,563
I believe the difference is that "Memory" represents active unpurgable memory whereas "Real Memory" is the total of active memory and virtual memory for a process.

I could be wrong though as Apple doesn't really have documentation that directly talks about the activity monitor column.

Here's probably the best sumuary of activity monitors memory stuff: http://apple.stackexchange.com/a/112502
 
  • Wow
Reactions: b.inazawa-fan
Real Memory is what is commonly referred to as RSS or Resident Set Size in Unix.
This is the number of "pages" (regions of physical memory) that are currently occupied by the process.

Processes also have "virtual" memory that counts as part of of its size but is paged in on demand. For example a memory-mapped file (i.e. a movie) will be paged in chunk by chunk whenever an address of its virtual mapping is accessed.

Real memory can be paged to swap, because it is not file-backed (it's allocated on the heap), which reduces process size but is paged in from swap on demand.

Also, real memory regions can be pinned to be resident all the time.
Hope this helps.

EDIT:

Sorry, forgot to mention:

"Memory" is usually smaller than "Real Memory" because System Frameworks are mapped in each process (indicated as "Real Memory"), but are shared between processes. Therefore the "Memory" column only counts regions that are not shared, i.e. the memory allocated only by this process.
 
Last edited:
  • Like
Reactions: 5vrTee
Thank you both for the information.

I'm surprised Apple doesn't make this information more readily available.
 
Activity Monitor and understanding memory

https://help.apple.com/activitymonitor/mac/10.9/help/index.html?localePath=en.lproj#actmntr1004 (content that's normally seen in Help Centre) is not entirely correct. At least: the explanation of virtual memory is wrong.

Better: How to use Activity Monitor – Apple Support (referred from http://apple.stackexchange.com/a/123978/8546).

It's terribly difficult to find memory-related documentation that's both user-friendly (plain english) and not open to misinterpretation.

It's not Apple's style, but a comic strip approach could be good for people who have minimal technical knowledge and wish to learn a little more without being overwhelmed.

Food for thought, from 2008: The Google Chrome Comic

Thank you for the Apple support link, they make those really hard to find sometimes.

I remember reading that comic years ago, good times...:)
 
Register on MacRumors! This sidebar will go away, and you'll see fewer ads.