Hi, I'm inputting the data from a survey I did for my graphic design coursework, into Numbers to make it look good for presenting.
But I'm pulling my hair out trying to just make the simplest of graphs! I've watched the Apple instructional videos to no avail and I'm totally stumped on such a silly thing!
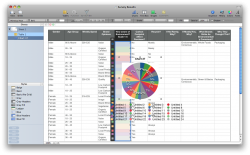
This is the data I am using, I select a column of data and want to present it with a pie chart, say ratio of males to females...

But I'm just getting this for everything! Blank tables and pie charts just stating 100%!


Thanks for the help...
But I'm pulling my hair out trying to just make the simplest of graphs! I've watched the Apple instructional videos to no avail and I'm totally stumped on such a silly thing!
This is the data I am using, I select a column of data and want to present it with a pie chart, say ratio of males to females...
But I'm just getting this for everything! Blank tables and pie charts just stating 100%!
Thanks for the help...