Hi everyone,
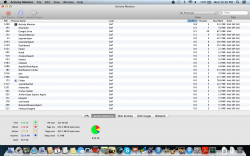
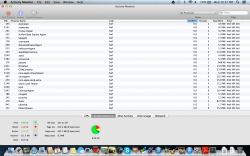
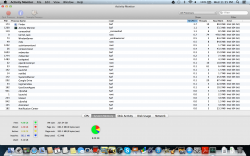
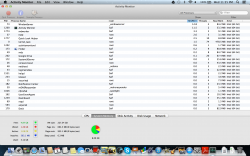
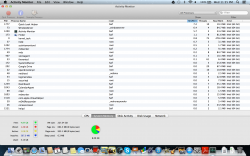
My 13 inch rMBP doesn't have any apps or documents or anything open, and I went to actcivity monitor to chech ram usage and 3.10 to 3.20 gb was used (out of 8gb), while my macbook air is only using 1.33 gb (out of 4) and they have the same apps. Why is that?
Thanks
My 13 inch rMBP doesn't have any apps or documents or anything open, and I went to actcivity monitor to chech ram usage and 3.10 to 3.20 gb was used (out of 8gb), while my macbook air is only using 1.33 gb (out of 4) and they have the same apps. Why is that?
Thanks