Can somebody explain the shares app. I just dont get it!!!
Look at the attached image.
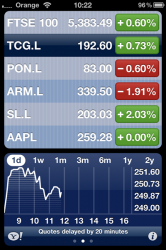
The price on the right goes from 249 − 251 but the actual share price is 192.
Why is it plotted on the graph as 249.87?
The same happens for other shares and if I select the days/weeks/months options they do not reflect any dates that make sense!!
Look at the attached image.
The price on the right goes from 249 − 251 but the actual share price is 192.
Why is it plotted on the graph as 249.87?
The same happens for other shares and if I select the days/weeks/months options they do not reflect any dates that make sense!!