Hi there. I have a MacBook Air (mid 2013) which has recently starting slowing dramatically, and beachballing constantly. I did a clean install from USB bootable drive of High Sierra just yesterday and the only apps I've downloaded onto it are Etrecheck and Black Magic Disk Speed (reports of both below). I've reset PRAM and SMC, and also run fsck -fy in Single User Mode, in addition to performing First Aid within Disk Utility. I haven't yet run a SMART test as I thought I could do it from Etrecheck, but can't seem to find the option. Any assistance with what could be wrong, and what can be done to solve it (I'm expecting a failing SSD ...) would be gratefully appreciated.
It's currently running MacOS High Sierra 10.13.3
MacBook Air (11-inch, Mid 2013)
1.3 GHz Intel Core i5
4GB 1600MHz DDR3
Intel HD Graphics 5000 1536MB
APPLE SSD TS0256F (TRIM enabled)
Disk Speed indicates a rather slow write speed of 78.8MB/s and read at 144.1MB/s.
Etrecheck report:
EtreCheck version: 4.1 (4A162)
Report generated: 2018-03-06 20:38:20
Download EtreCheck from https://etrecheck.com
Runtime: 21:51
Performance: Poor
Problem: Beachballing
Major Issues:
Anything that appears on this list needs immediate attention.
No Time Machine backup - Time Machine backup not found.
Poor performance - EtreCheck report took over 10 minutes to run. This is very unusual.
Minor Issues:
These issues do not need immediate attention but they may indicate future problems.
32-bit Apps - This machine has 32-bits apps that may have problems in the future.
Hardware Information:
MacBook Air (11-inch, Mid 2013)
MacBook Air Model: MacBookAir6,1
1 1.3 GHz Intel Core i5 (i5-4250U) CPU: 2-core
4 RAM Not upgradeable
BANK 0/DIMM0
2 GB DDR3 1600 ok
BANK 1/DIMM0
2 GB DDR3 1600 ok
Battery: Health = Normal - Cycle count = 561
Video Information:
Intel HD Graphics 5000 - VRAM: 1536 MB
Color LCD 1366 x 768
Drives:
disk0 - APPLE SSD TS0256F 251.00 GB (Solid State - TRIM: Yes)
Internal PCI 5.0 GT/s x2 Serial ATA
disk0s1 - EFI (MS-DOS FAT32) [EFI] 210 MB
disk0s2 250.14 GB
disk1s1 - Macintosh HD (APFS) 250.14 GB 20.17 GB
disk1s2 - Preboot (APFS) [APFS Preboot] 250.14 GB 40 MB
disk1s3 - Recovery (APFS) [Recovery] 250.14 GB 1.03 GB
disk1s4 - VM (APFS) [APFS VM] 250.14 GB 1.07 GB
Mounted Volumes:
disk1s1 - Macintosh HD 250.14 GB (227.73 GB free)
APFS
Mount point: /
Encrypting: 42% done
disk1s4 - VM [APFS VM] 250.14 GB (227.73 GB free)
APFS
Mount point: /private/var/vm
Network:
Interface en0: Wi-Fi
802.11 a/b/g/n/ac
One IPv4 address
Interface en2: Bluetooth PAN
Interface bridge0: Thunderbolt Bridge
iCloud Quota: 2.64 GB available
System Software:
macOS High Sierra 10.13.3 (17D47)
Time since boot: Less than an hour
System Load: 1.73 (1 min ago) 1.54 (5 min ago) 0.98 (15 min ago)
Security:
System Status
Gatekeeper Mac App Store and identified developers
System Integrity Protection Enabled
32-bit Applications:
Name Version
quicklookd32 5.0
DVD Player 5.8
InkServer 10.9
System Launch Agents:
[Not Loaded] 8 Apple tasks
[Loaded] 170 Apple tasks
[Running] 112 Apple tasks
System Launch Daemons:
[Not Loaded] 37 Apple tasks
[Loaded] 183 Apple tasks
[Running] 111 Apple tasks
Internet Plug-ins:
QuickTime Plugin: 7.7.3 (installed 2018-01-19)
Time Machine:
Time Machine Not Configured!
Top Processes by CPU:
Process (count) Source % of CPU
system_profiler Apple 85
kernel_task Apple 8
com.apple.WebKit.WebContent (5) Apple 7
WindowServer Apple 6
Finder Apple 6
Top Processes by Memory:
Process (count) Source RAM usage
com.apple.WebKit.WebContent (6) Apple 1.26 GB
kernel_task Apple 498 MB
system_profiler Apple 355 MB
mdworker (18) Apple 197 MB
Safari Apple 125 MB
Top Processes by Network Use:
Process Source Input Output
com.apple.WebKit.Networking Apple 3 MB 167 KB
mDNSResponder Apple 65 KB 24 KB
apsd Apple 6 KB 12 KB
netbiosd Apple 3 KB 938 B
rapportd Apple 714 B 760 B
Top Processes by Energy Use:
Process (count) Source Energy usage (0-100)
com.apple.WebKit.WebContent (6) Apple 9
WindowServer Apple 5
VTDecoderXPCService Apple 2
Safari Apple 2
hidd Apple 1
Virtual Memory Information:
Available RAM 901 MB
Free RAM 20 MB
Used RAM 3.12 GB
Cached files 881 MB
Swap Used 0 B
Software Installs (past 30 days):
Name Version Install Date
Disk Speed Test 3.1 2018-03-06
Diagnostics Information (past 7 days):
2018-03-06 20:08:24 Last Shutdown Cause: 0 - Power loss
2018-03-06 01:02:34 com.apple.WebKit.WebContent CPU
End of report
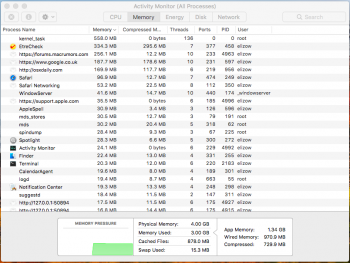
[doublepost=1520371332][/doublepost]Here are a couple of screenshots from Activity Monitor, in case this is of any use.


