Got a tip for us?
Let us know
Become a MacRumors Supporter for $50/year with no ads, ability to filter front page stories, and private forums.
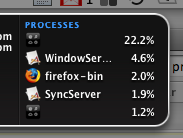
What is this process in iStat Pro?!
- Thread starter n8c
- Start date
- Sort by reaction score