I don't think GGJstudios should be so dismissive.
Lately, my Mac has been suffering from a similar problem. coreservicesd goes from its usual (and usually stable) tens of MB of memory to 1-2 GB, then within hours the computer locks up entirely and forces a hard reboot. Upon reboot, there is a kernel panic, forcing a second reboot. Not pretty.
Glad to hear it might not be just me.
So far, I'm not getting anything helpful from Console. I've tried quitting all running GUI apps, menu bar apps, and going through activity monitor and quitting anything I see that doesn't need to be running, which doesn't seem to have any effect. Quitting coreservicesd causes the computer to freeze.
I've tried cleaning out my system and user caches, repairing permissions, safe reboot (or as much of it as possible with Filevault 2 enabled)...
Even though the RAM goes up and the fan starts spinning up, the CPU usage remains low.
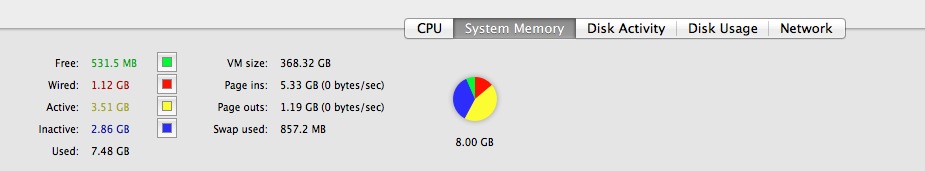
I have 8 GB RAM, so I still have some free RAM, but obviously something is going on here, and OSX is not doing a perfect job of "managing my Mac's memory" all by itself.
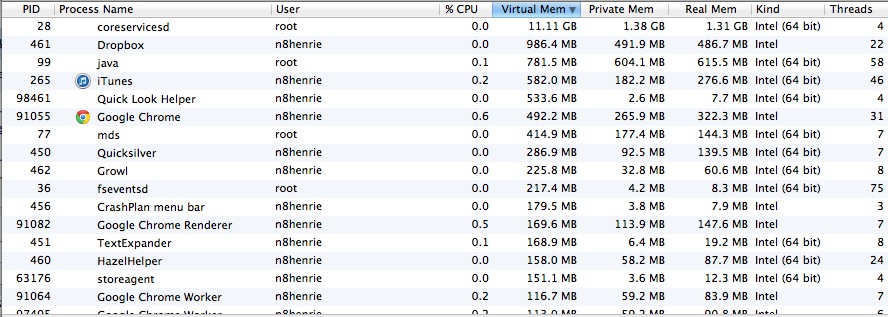
Here's my Activity Monitor output
Active Memory: 3.44 GB
Free Memory: 631.6 MB
Wired Memory: 1.13 GB
Used Memory: 7.38 GB
Inactive Memory: 2.82 GB
Total VM: 359.74 GB
Number of processes: 174
PID Process Name User CPU Real Mem Virtual Mem
0 kernel_task root 2.2 727.6 MB 6.45 GB
1 launchd root 0.0 2.4 MB 2.35 GB
11 UserEventAgent root 0.0 6.5 MB 2.43 GB
12 kextd root 0.0 8.3 MB 2.37 GB
13 taskgated root 0.0 7.9 MB 2.39 GB
14 notifyd root 0.0 2.1 MB 2.35 GB
15 diskarbitrationd root 0.0 2.6 MB 2.35 GB
16 configd root 0.0 6.4 MB 2.38 GB
17 securityd root 0.0 8.9 MB 2.37 GB
18 syslogd root 0.0 2.0 MB 2.35 GB
19 cfprefsd root 0.0 2.8 MB 2.35 GB
20 powerd root 0.0 2.4 MB 2.37 GB
21 distnoted root 0.0 2.3 MB 2.36 GB
22 opendirectoryd root 0.0 18.6 MB 2.52 GB
29 coreservicesd root 8.5 1.19 GB 4.15 GB
48 fseventsd root 0.1 9.9 MB 2.49 GB
49 mDNSResponder _mdnsrespo 0.0 5.3 MB 2.38 GB
50 networkd _networkd 0.0 1.8 MB 2.35 GB
51 httpd root 0.0 3.1 MB 2.35 GB
53 warmd nobody 0.0 10.7 MB 2.46 GB
54 usbmuxd _usbmuxd 0.0 7.5 MB 2.38 GB
57 stackshot root 0.0 1.6 MB 2.35 GB
60 revisiond root 0.0 4.9 MB 2.40 GB
63 ODSAgent root 0.0 4.1 MB 2.40 GB
66 mds root 0.1 134.5 MB 3.94 GB
69 loginwindow n8henrie 0.0 24.6 MB 2.59 GB
70 locationd _locationd 0.0 13.4 MB 2.48 GB
71 KernelEventAgent root 0.0 1.4 MB 2.34 GB
72 kdc root 0.0 4.1 MB 2.37 GB
74 hidd root 1.2 5.4 MB 2.40 GB
76 dynamic_pager root 0.0 1.0 MB 2.33 GB
79 corestoraged root 0.0 6.6 MB 2.38 GB
80 appleeventsd _eppc 0.0 15.1 MB 2.40 GB
86 autofsd root 0.0 3.3 MB 2.37 GB
87 apsd root 0.0 14.3 MB 2.48 GB
90 java root 0.2 621.8 MB 3.26 GB
92 netbiosd _netbios 0.1 4.0 MB 2.38 GB
93 ntpd root 0.0 1.5 MB 2.35 GB
94 cupsd root 0.0 8.6 MB 2.41 GB
95 cron root 0.0 1.2 MB 2.33 GB
96 SystemStarter root 0.0 1.6 MB 2.35 GB
98 aosnotifyd root 0.0 12.4 MB 2.48 GB
99 socketfilterfw root 0.0 10.1 MB 2.42 GB
119 WindowServer _windowser 7.3 122.2 MB 2.98 GB
211 httpd _www 0.0 420 KB 2.35 GB
224 CVMServer root 0.0 2.0 MB 2.38 GB
239 logind root 0.0 3.1 MB 2.37 GB
248 launchd n8henrie 0.0 2.2 MB 2.35 GB
251 UserEventAgent n8henrie 0.0 14.6 MB 2.50 GB
252 distnoted n8henrie 0.0 11.8 MB 2.37 GB
254 cfprefsd n8henrie 0.0 55.7 MB 2.40 GB
260 pboard n8henrie 0.0 1.1 MB 2.33 GB
268 Calendar n8henrie 0.0 78.4 MB 2.74 GB
270 OmniFocus n8henrie 0.0 33.0 MB 802.1 MB
274 talagent n8henrie 0.0 12.9 MB 2.50 GB
275 SystemUIServer n8henrie 0.0 36.4 MB 2.78 GB
276 Finder n8henrie 0.3 67.0 MB 3.86 GB
277 coreaudiod _coreaudio 0.0 14.3 MB 2.49 GB
280 imklaunchagent n8henrie 0.0 5.4 MB 2.38 GB
282 fontd n8henrie 0.0 8.6 MB 2.42 GB
289 usernoted n8henrie 0.0 9.5 MB 2.42 GB
290 Notification Center n8henrie 0.0 25.8 MB 2.57 GB
291 filecoordinationd root 0.0 5.1 MB 2.37 GB
294 NetworkBrowserAgent n8henrie 0.0 6.4 MB 2.39 GB
299 lsboxd n8henrie 0.0 4.0 MB 2.40 GB
306 imagent n8henrie 0.0 10.8 MB 2.44 GB
370 iTunes Helper n8henrie 0.0 7.2 MB 2.45 GB
384 AppleSpell.service n8henrie 0.0 8.4 MB 2.42 GB
386 Photo Stream n8henrie 0.0 22.5 MB 2.58 GB
397 AirPort Base Station Agen n8henrie 0.0 4.9 MB 2.41 GB
400 Citrix Service Record App n8henrie 0.0 11.8 MB 2.51 GB
403 Google Chrome Helper n8henrie 0.0 26.3 MB 784.3 MB
406 QuickCal n8henrie 0.0 51.6 MB 2.64 GB
409 Divvy n8henrie 0.0 11.7 MB 725.5 MB
410 Cloud n8henrie 0.0 21.8 MB 2.61 GB
412 TextExpander n8henrie 0.2 30.3 MB 3.63 GB
413 GrowlVoice n8henrie 0.9 65.5 MB 2.64 GB
414 PsstDaemon n8henrie 0.0 5.0 MB 671.8 MB
415 I Love Stars n8henrie 0.0 15.7 MB 2.53 GB
416 Google Drive n8henrie 0.0 60.2 MB 790.1 MB
417 CrashPlan menu bar n8henrie 0.1 6.8 MB 811.9 MB
418 Due n8henrie 0.0 19.2 MB 2.57 GB
422 HazelHelper n8henrie 0.0 56.0 MB 2.71 GB
423 Dropbox n8henrie 0.1 208.2 MB 1.00 GB
424 Air Display n8henrie 0.0 12.4 MB 2.53 GB
425 AwakenHelper n8henrie 0.0 6.0 MB 672.6 MB
427 Growl n8henrie 0.0 67.1 MB 3.70 GB
443 librariand n8henrie 0.0 15.7 MB 2.55 GB
444 ubd n8henrie 0.0 20.6 MB 2.56 GB
446 CloudRaindropHelper n8henrie 0.0 9.7 MB 2.47 GB
448 CloudRaindropHelper n8henrie 0.0 12.6 MB 2.49 GB
451 TextExpander Helper n8henrie 0.0 16.2 MB 2.54 GB
479 dbfseventsd root 0.0 172 KB 582.7 MB
480 dbfseventsd root 0.0 4.2 MB 590.7 MB
481 dbfseventsd n8henrie 0.0 96 KB 582.7 MB
535 Image Capture Extension n8henrie 0.0 3.9 MB 2.55 GB
629 syspolicyd root 0.0 44 KB 2.35 GB
1269 Quicksilver n8henrie 0.0 116.6 MB 2.92 GB
20055 cookied n8henrie 0.0 2.7 MB 2.35 GB
20772 System Events n8henrie 0.0 6.6 MB 2.56 GB
26410 Dictation n8henrie 0.0 27.3 MB 2.60 GB
26589 SleepServicesD root 0.0 2.9 MB 2.37 GB
26593 pbs n8henrie 0.0 9.0 MB 2.38 GB
26631 tccd n8henrie 0.0 88.1 MB 2.49 GB
26684 launchd _spotlight 0.0 1.1 MB 2.35 GB
26689 distnoted _spotlight 0.0 1.7 MB 2.36 GB
26690 cfprefsd _spotlight 0.0 1.8 MB 2.34 GB
26841 xpcd n8henrie 0.0 10.7 MB 2.47 GB
27040 CalendarAgent n8henrie 0.0 94.6 MB 2.64 GB
27047 accountsd n8henrie 0.0 10.9 MB 2.47 GB
30775 Tweetbot n8henrie 0.0 86.4 MB 2.80 GB
31090 com.apple.hiservices-xpcs n8henrie 0.0 9.2 MB 2.46 GB
31091 com.apple.audio.SandboxHe n8henrie 0.0 9.3 MB 2.46 GB
31826 ssh-agent n8henrie 0.0 4.8 MB 2.38 GB
33184 coresymbolicationd root 0.0 2.8 MB 2.34 GB
34794 printtool n8henrie 0.0 4.2 MB 2.40 GB
36767 Dock n8henrie 0.0 49.7 MB 2.56 GB
36774 com.apple.dock.extra n8henrie 0.0 58.3 MB 2.63 GB
49790 launchd nobody 0.0 824 KB 2.35 GB
49792 cfprefsd nobody 0.0 1.1 MB 2.34 GB
52781 iTunes n8henrie 0.3 283.4 MB 3.02 GB
52782 CloudRaindropHelper n8henrie 0.0 9.7 MB 2.47 GB
52795 ath n8henrie 0.0 6.1 MB 2.39 GB
52801 ath n8henrie 0.0 5.4 MB 2.39 GB
52805 AppleMobileDeviceHelper n8henrie 0.0 19.4 MB 2.51 GB
68679 mdworker n8henrie 1.2 35.1 MB 2.54 GB
71355 Google Chrome n8henrie 0.5 263.0 MB 1.19 GB
71357 CloudRaindropHelper n8henrie 0.0 9.7 MB 2.47 GB
71359 Google Chrome Worker n8henrie 0.0 71.3 MB 790.0 MB
71360 Google Chrome Worker n8henrie 0.3 58.7 MB 819.1 MB
71365 Google Chrome Worker n8henrie 0.0 14.0 MB 753.0 MB
71367 Google Chrome Renderer n8henrie 0.0 68.3 MB 926.7 MB
71369 Google Chrome Renderer n8henrie 12.9 136.9 MB 895.5 MB
71370 Google Chrome Helper n8henrie 0.0 11.9 MB 753.0 MB
71371 Google Chrome Worker n8henrie 0.0 19.7 MB 754.5 MB
71372 Google Chrome Renderer n8henrie 0.1 38.9 MB 816.1 MB
71373 Google Chrome Worker n8henrie 0.0 15.1 MB 753.5 MB
71374 Google Chrome Renderer n8henrie 0.0 75.6 MB 850.5 MB
71375 Google Chrome Worker n8henrie 0.0 14.2 MB 752.7 MB
71376 Google Chrome Worker n8henrie 0.0 14.0 MB 752.2 MB
71377 Google Chrome Renderer n8henrie 0.1 46.2 MB 795.9 MB
71378 Google Chrome Worker n8henrie 0.1 87.1 MB 806.4 MB
71379 Google Chrome Worker n8henrie 0.0 47.2 MB 782.9 MB
71380 Google Chrome Worker n8henrie 0.0 16.4 MB 755.7 MB
71381 Google Chrome Renderer n8henrie 0.1 73.4 MB 814.8 MB
71382 Google Chrome Worker n8henrie 0.0 17.1 MB 756.3 MB
71383 Google Chrome Worker n8henrie 0.0 16.4 MB 752.9 MB
71385 Google Chrome Worker n8henrie 0.0 24.2 MB 756.3 MB
71388 Google Chrome Worker n8henrie 0.0 14.1 MB 757.1 MB
71390 Google Chrome Worker n8henrie 0.0 15.8 MB 757.0 MB
71391 Google Chrome Worker n8henrie 0.0 14.7 MB 757.1 MB
71395 Google Chrome Helper n8henrie 0.0 41.9 MB 756.1 MB
71396 Google Chrome Worker n8henrie 0.0 16.2 MB 757.0 MB
71398 NPLastPass (Chrome Plug-I n8henrie 0.0 7.6 MB 718.9 MB
71400 Google Chrome Worker n8henrie 0.0 16.2 MB 756.7 MB
71401 Google Chrome Worker n8henrie 0.0 17.9 MB 761.4 MB
71402 Google Chrome Worker n8henrie 0.0 19.6 MB 762.1 MB
71403 Google Chrome Worker n8henrie 0.0 22.2 MB 761.2 MB
71404 PepperFlashPlayer (Chrome n8henrie 0.1 9.8 MB 744.0 MB
71405 VDCAssistant root 0.0 10.4 MB 2.50 GB
71412 Google Talk NPAPI Plugin n8henrie 0.0 6.9 MB 716.3 MB
71413 GoogleTalkPlugin n8henrie 0.0 6.7 MB 725.8 MB
71566 webdavfs_agent n8henrie 0.0 9.4 MB 2.39 GB
71610 Activity Monitor n8henrie 9.8 58.8 MB 2.66 GB
71612 activitymonitord root 58.5 3.7 MB 2.35 GB
71625 Google Chrome Renderer n8henrie 0.2 74.9 MB 843.5 MB
71635 Terminal n8henrie 0.0 25.2 MB 2.54 GB
71637 login root 0.0 9.4 MB 2.45 GB
71642 bash n8henrie 0.0 2.2 MB 2.33 GB
71679 appleprofilepolicyd root 0.0 1.3 MB 2.34 GB
71703 com.apple.iCloudHelper n8henrie 0.0 21.7 MB 2.48 GB
71719 Google Chrome Worker n8henrie 0.1 83.6 MB 802.6 MB
71749 mdworker n8henrie 0.0 25.0 MB 2.46 GB
71762 sandboxd root 0.0 13.6 MB 2.40 GB