Become a MacRumors Supporter for $50/year with no ads, ability to filter front page stories, and private forums.

w1z

macrumors 6502a
Original poster
Aug 20, 2013
692
481
So I have been facing a dilemma and was hoping for some expert opinion/advice as I am baffled by this problem..

I loaded my cMP 2008 with 64GB 667MHz 8x8GB Crucial memory (server-grade) and noticed an impact/penalty of 50% on my SSDs transfer speeds, however, with 48GB loaded the results are as expected and the SSDs are performing at the maximum achievable speeds on a Sonnet Tempo Pro pcie card.

All 8 ram modules have been stress tested and verified including the brand new memory risers - no errors whatsoever. So what could be causing this?
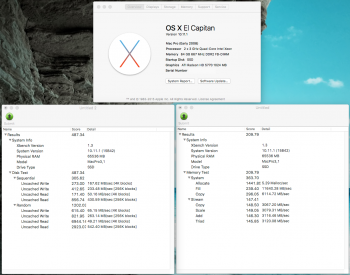
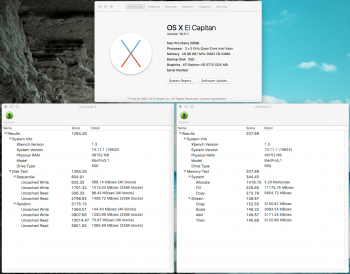
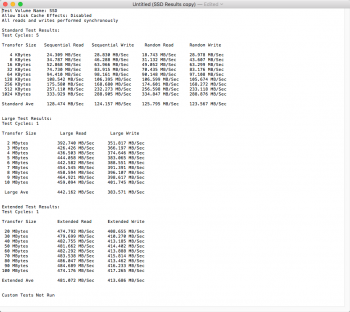
64GB-MACPRO-2008-SLOWDISK.png 48GB-MACPRO-2008-FASTDISK.png

Thanks!
 
It's amazing that your system works with these amounts of RAM, I think that the maximum supported RAM in MP 3,1 was 32 gb, of course many times Apple doesn't update these specs.

Are all the exact same modules?
Are their electric specs (voltage etc) suitable for the 3,1? perhaps too many of them exceed the MP's capability to feed them, so please check them with istat while add or remove some of them.
Have you mixed their order to see if the last two have any problem?
 
Are all the exact same modules?
Are their electric specs (voltage etc) suitable for the 3,1? perhaps too many of them exceed the MP's capability to feed them, so please check them with istat while add or remove some of them.
Have you mixed their order to see if the last two have any problem?

Yes, all modules are from the same batch/factory. I also tried loading a combination of 2x8gb + 2x4gb (owc) on risers A and B for a total of 48gb with no impact on SSD transfer speeds or any lag.

It's only when the full 64gb of memory modules are loaded do the SSD speeds suffer which causes some lag when loading applications after a fresh reboot.

Electrical readings are within operating specs and the temps are anywhere between 39C and 45C as I replaced crucial's heatsinks with apple's.

I also tried switching the sonnet pcie card from slot 4 to slot 3 - same results.

I wonder what could be causing this :( I would be interested in seeing whether other cMP 2008 owners with similar 48gb/64gb mem setups are experiencing the same issue.

Unfortunately I can't help you more since I have only 28 gb installed in mine.
Have you tried, with all the modules installed, a PRAM and SMC reset?
 
...
I loaded my cMP 2008 with 64GB 667MHz 8x8GB Crucial memory (server-grade) and noticed an impact/penalty of 50% on my SSDs transfer speeds, however, with 48GB loaded the results are as expected and the SSDs are performing at the maximum achievable speeds on a Sonnet Tempo Pro pcie card.

All 8 ram modules have been stress tested and verified including the brand new memory risers - no errors whatsoever. So what could be causing this?

For 2008 era CPUs the PCIe lanes and the memory lanes are all sharing the same bus to the CPU cores. The memory and PCIe are collected in a "Northbridge" chip and there is one (only one) shared connection to the cores. So the bandwidth is fixed.

Not 100% sure how the memory is laid out but if the Mac Pro tries to equally distribute the lower memory to all of the DIMM sticks then using 8 slots versus 6 slots means putting more "consumers" on that shared bandwidth. Back in the 2008 era there were relatively few cards putting bandwidth pressure on the a RAID card will. I could be a switch that crumbles when too much low latency, high bandwidth traffic is thrown at it. [ all of the PCI-e slots are not PCI-e v2 so there is a bandwidth limitation in the design otherwise they could have cranked the other 2 slots higher. ]

More high latency storage is a natural "speed break" that slow down the CPU memory requests. Remove the speed break and now may have a traffic problem.

I wouldn't expect a 50% drop solely from that though.

If the PCI-e connection is disrupted ( due to placement) is another place to look. (e.g., something pushed the card into a sub PCI-e v2.0 mode. ) That would account for a 50% drop in bandwidth.
 
  • Like
Reactions: Rico
I have read somewhere that Xbench is not well supported in the last couple of OS X generations (or I suppose it's newer generations of hardware :D ). That suite hasn't had any updates for nearly ten years. I think you can not expect that it will give you valid results on an El Cap system.
You might rerun your benchmarks with something more relevant. Black Magic Speed Test might be a good test, for one...
 
Last edited:
Unfortunately I can't help you more since I have only 28 gb installed in mine.
Have you tried, with all the modules installed, a PRAM and SMC reset?

No worries - thanks for trying... As for PRAM/SMC - I always run these commands at the beginning of a troubleshooting exercise.

For 2008 era CPUs the PCIe lanes and the memory lanes are all sharing the same bus to the CPU cores. The memory and PCIe are collected in a "Northbridge" chip and there is one (only one) shared connection to the cores. So the bandwidth is fixed.

Not 100% sure how the memory is laid out but if the Mac Pro tries to equally distribute the lower memory to all of the DIMM sticks then using 8 slots versus 6 slots means putting more "consumers" on that shared bandwidth. Back in the 2008 era there were relatively few cards putting bandwidth pressure on the a RAID card will. I could be a switch that crumbles when too much low latency, high bandwidth traffic is thrown at it. [ all of the PCI-e slots are not PCI-e v2 so there is a bandwidth limitation in the design otherwise they could have cranked the other 2 slots higher. ]

More high latency storage is a natural "speed break" that slow down the CPU memory requests. Remove the speed break and now may have a traffic problem.

I wouldn't expect a 50% drop solely from that though.

If the PCI-e connection is disrupted ( due to placement) is another place to look. (e.g., something pushed the card into a sub PCI-e v2.0 mode. ) That would account for a 50% drop in bandwidth.

Slot 2 ( which is matched to the PCI-e v2.0 of the card ) ? ( as a test. )

Some valid points there- thanks, but I also tried moving the sonnet tempo pro card to slot 2 with the same results.

My current PCIe setup is as follows:

- SLOT 1 (v2) --> ATI 5770 | Link Width=x16 | Link Speed= 5.0GT/s
- SLOT 2 (v2) --> Areca 1882ix-12 | Link Width=x8 | Link Speed= 5.0GT/s
- SLOT 3 (v1.1) --> empty
- SLOT 4 (v1.1) --> Sonnet Tempo Pro with 2 M550s x 512GB (no raid) | Link Width=x2 per SSD | Link Speed= 5.0GT/s (same link width and speed when installed in SLOT 2)

Performance of your Sonnet card & hence the SSD will be slugged if it's in slot 3 or 4. It needs to be in slot 1 or 2.

What software are you benchmarking with? Most people use Black Magic Speed Test from the App Store or download AJA System Test https://www.aja.com/en/products/aja-system-test

As per sonnet's tempo pro manual, The card supports x4 lanes at 5.0GT/s (split between 2 ssd drives) in slot 3 or 4 of cMP 2008.

I tried bench-marking the drives using Black Magic and AJA - speeds were halved, if not more, when the full 64gb of mem were installed.

I have read somewhere that Xbench is not well supported in the last couple of OS X generations. That suite hasn't had any updates for nearly ten years. I think you can not expect that it will give you valid results on an El Cap system.
You might rerun your benchmarks with something more relevant. Black Magic Speed Test might be a good test, for one...

I am getting the same results in SpeedTools Utilities Pro (QuickBench v4).. Black Magic and AJA aren't the best bench-marking tools for real-world tests.

48GB-MACPRO-2008-SSD-BENCH.png

Thanks again everyone for taking the time to chime in on my thread... anymore ideas?
 
...
My current PCIe setup is as follows:

- SLOT 1 (v2) --> ATI 5770 | Link Width=x16 | Link Speed= 5.0GT/s
- SLOT 2 (v2) --> Areca 1882ix-12 | Link Width=x8 | Link Speed= 5.0GT/s
- SLOT 3 (v1.1) --> empty
- SLOT 4 (v1.1) --> Sonnet Tempo Pro with 2 M550s x 512GB (no raid) | Link Width=x2 per SSD | Link Speed= 5.0GT/s (same link width and speed when installed in SLOT 2)

There are no changes to the bandwidth to the spinners on the back end of that Areca when move to 64GB ?
If that hiccuped too (perhaps to a much lessor extent ) then something about the config is spanning the PCI-e subsystem. Otherwise probably going to need Sonnet specific diagnostics/expertise to get to the root cause.


P.S. While the MP 2008 is on OS 10.11 supported list ( https://support.apple.com/kb/SP728?locale=en_US ) I suspect this is a configuration that Apple doesn't test. there could be core kernel problem here with how the I/O interrupts are handled when distributed through these 'denser' DIMMs.
 
Last edited:
  • Like
Reactions: w1z and filmak
There are no changes to the bandwidth to the spinners on the back end of that Areca when move to 64GB ?
If that hiccuped too (perhaps to a much lessor extent ) then something about the config is spanning the PCI-e subsystem. Otherwise probably going to need Sonnet specific diagnostics/expertise to get to the root cause.


P.S. While the MP 2008 is on OS 10.11 supported list ( https://support.apple.com/kb/SP728?locale=en_US ) I suspect this is a configuration that Apple doesn't test. there could be core kernel problem here with how the I/O interrupts are handled when distributed through these 'denser' DIMMs.

Two words: "bounce buffers".

-JimJ

No changes or impact on Areca when system is loaded with 64GB but you both are onto something here... I am going to reboot into partedmagic's os with 64GB installed and will bench-mark the ssds then as I just recalled seeing better speed results under maverick's 10.9.5 / osx recovery ie. terminal dd if=/dev/zero of=temp bs=1024k count=1024

@jimj740 Could you please elaborate more as I couldn't find that much information on the subject in relation to mac pros/apple?

Thanks!
 
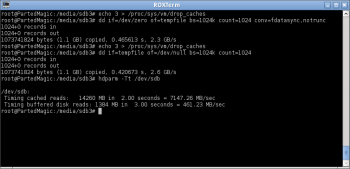
It seems OS X is the culprit here as I am not seeing any bottlenecks/bounce buffer issues under partedmagic's linux os/kernel.

Screenshot - 11232015 - 11:34:08 PM.png Screenshot - 11232015 - 11:39:19 PM.png

Anyway to get around this via nvram and/or startup on OS X?
 
Quick update - just tried running the same dd tests in single user mode on El Capitan with 64gb mem and the ssd drives were hitting 450+ MB/s writes and 1.3+ GB/s reads but as soon as I am out of single user mode I was back again at sub 250 MB/s writes and 380 MB/s reads

So I am now leaning towards either OS X memory management issues, I/O Kit bugs or OS/hardware restrictions/limitations imposed by Apple in Yosemite / El Capitan as I witnessed the same performance impact under both Yosemite/El Capitan's recovery modes via terminal but not under Mavericks!!
 
  • Like
Reactions: VAGDesign
Not many people use the Sonnet Tempo Pro so it would be interesting to know if the same phenomenon is seen with the more common Apricorn Velocity cards. I guess that I will find out for myself soon enough a I have 64GB on the way for my 3,1.
 
The 3,1 has performance issues with newer GPU cards having a performance penalty.
So there may be something, OS X related, with the PCIe bus.
it was recommended to delete some yosemite kext files (related to power management ?) to have a little better performance.
I think that the last full speed OS was 10.8, if I remember well.
 
It's interesting that the problem goes away in SU mode. So the real question is: what are the differences between SU mode and normal mode. One of them is the culprit.

I'd guess it's a third party driver, but that's is just a guess.

Hopefully someone else can elaborate on the differences and possible work around.
 
Not many people use the Sonnet Tempo Pro so it would be interesting to know if the same phenomenon is seen with the more common Apricorn Velocity cards. I guess that I will find out for myself soon enough a I have 64GB on the way for my 3,1.

I agree.. I'd appreciate if you could report back with your findings.

The 3,1 has performance issues with newer GPU cards having a performance penalty.
So there may be something, OS X related, with the PCIe bus.
it was recommended to delete some yosemite kext files (related to power management ?) to have a little better performance.
I think that the last full speed OS was 10.8, if I remember well.

It's definitely OS X/Apple related, specifically with Yosemite and El Cap... I don't think the power management kexts are causing this but will look into it - thanks!

It's interesting that the problem goes away in SU mode. So the real question is: what are the differences between SU mode and normal mode. One of them is the culprit.

I'd guess it's a third party driver, but that's is just a guess.

Hopefully someone else can elaborate on the differences and possible work around.

It's as clear as daylight that whatever is applying the speed brakes on / taxing the memory and io controller hubs' bandwidth is only occurring under normal / recovery modes which could only mean that some Apple-related kext/software/function is causing this as I didn't install any third-party drivers/kexts (clean install without fde/filevault2 enabled). I also carried out the tests without the Areca raid card installed - same results!!
 
I had originally assumed this issue was specific to your hardware, however while investigating a different performance anomaly I came to understand the root issue you are facing and it is not specific to your hardware...

It comes down to two factors:

1) OS X has no form of direct IO, and even the F_NOCACHE flag is both advisory and defeated if a block is already in the cache. All writes less than 16K in size are cached, and depending on several factors (one of which appears to be available memory) the operating system will coalesce sequential writes into much larger writes. If the time to perform the coalesced write is less than the time to buffer and coalesce them, this leads to a situation where the queue depth alternates between zero and one - e.g. the device is starved for I/O.

2) Due to this caching, the benchmarking tools for disks on the Macintosh are practically useless in characterizing the performance of very fast devices that support large data transfers. I have seen 4,480 sequential 8K writes coalesced into a single 35MB write!

A simple test to illustrate these points: Copy a large file (like a DVD iso) to your device. Then open up activity monitor and display the disk performance. Now go to the finder and duplicate the large file on your device and watch the activity monitor for the device's performance. Finder uses both large I/O and multiple outstanding I/Os to keep the device saturated - you should see the same level of performance you observed in your 48GB system. By observing the number of IOPS and the data rate you can approximate the size of the coalesced I/Os.

For completeness sake you can record and compare the data rate and IOPS to compute the average I/O size while running your benchmark under both memory configurations to observe the evidence of the caching.

As for a work-around: don't issue small I/O, and issue I/O in parallel to keep the queue depths up. And don't take benchmarks too seriously.

-JimJ
 
  • Like
Reactions: w1z and pullman
Not many people use the Sonnet Tempo Pro so it would be interesting to know if the same phenomenon is seen with the more common Apricorn Velocity cards. I guess that I will find out for myself soon enough a I have 64GB on the way for my 3,1.
I can now confirm that there is a performance anomaly when you fit 8x8GB in a Mac Pro 3,1. I am using a Capricorn Velocity Duo with 2 x 1TB EVO 850 in RAID 0 & my usual read & write speeds are over 600MBps (as measured by Black Magic Speed Test. With 64GB I got about 200MBps write & 400MBps read. Swapping 4GB parts for a couple of the 8GB parts i.e 56GB (6x8GB+2x4GB) & performance is back to normal with about 640MBps write & 680MBps read
 
  • Like
Reactions: pullman
I had originally assumed this issue was specific to your hardware, however while investigating a different performance anomaly I came to understand the root issue you are facing and it is not specific to your hardware...

It comes down to two factors:

1) OS X has no form of direct IO, and even the F_NOCACHE flag is both advisory and defeated if a block is already in the cache. All writes less than 16K in size are cached, and depending on several factors (one of which appears to be available memory) the operating system will coalesce sequential writes into much larger writes. If the time to perform the coalesced write is less than the time to buffer and coalesce them, this leads to a situation where the queue depth alternates between zero and one - e.g. the device is starved for I/O.

2) Due to this caching, the benchmarking tools for disks on the Macintosh are practically useless in characterizing the performance of very fast devices that support large data transfers. I have seen 4,480 sequential 8K writes coalesced into a single 35MB write!

A simple test to illustrate these points: Copy a large file (like a DVD iso) to your device. Then open up activity monitor and display the disk performance. Now go to the finder and duplicate the large file on your device and watch the activity monitor for the device's performance. Finder uses both large I/O and multiple outstanding I/Os to keep the device saturated - you should see the same level of performance you observed in your 48GB system. By observing the number of IOPS and the data rate you can approximate the size of the coalesced I/Os.

For completeness sake you can record and compare the data rate and IOPS to compute the average I/O size while running your benchmark under both memory configurations to observe the evidence of the caching.

As for a work-around: don't issue small I/O, and issue I/O in parallel to keep the queue depths up. And don't take benchmarks too seriously.

-JimJ

Thanks for sharing your take on this, JimJ.. I carried out both tests with varying results on 10.8 vs 10.9/.10/.11

I'm suspecting the introduction of the memory compression feature in 10.9 onwards as I was able to utilize the full 64gb of ram in 10.8 with no negative impact whatsoever on the overall performance of the mac, including SSD performance ~480MB/s write and ~510MB/s read. As soon as I dropped the ram capacity to 48 or 56GB, the performance was stellar (for the 3,1) on 10.9+

I also tried disabling the memory compression + swap using vm_compressor=1 on 10.9+ but it was causing kernel panics / crashes.

I can now confirm that there is a performance anomaly when you fit 8x8GB in a Mac Pro 3,1. I am using a Capricorn Velocity Duo with 2 x 1TB EVO 850 in RAID 0 & my usual read & write speeds are over 600MBps (as measured by Black Magic Speed Test. With 64GB I got about 200MBps write & 400MBps read. Swapping 4GB parts for a couple of the 8GB parts i.e 56GB (6x8GB+2x4GB) & performance is back to normal with about 640MBps write & 680MBps read

Thanks for confirming the performance anomaly... 56GB is the sweet spot for the mac pro 2008 with vm_compressor=2 set in nvram (swap disabled). Everything is so zappy ie. virtual machines (startup/shutdown,copying, compiling), startup/shutdown times, copying and opening files.. can't believe I've been running the mac with 64gb for the past 8 months with such sluggish performance.

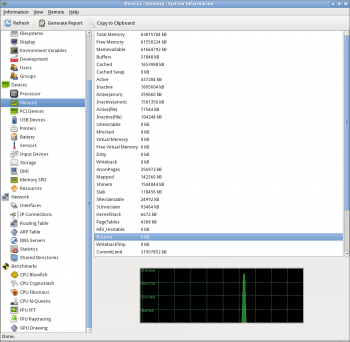
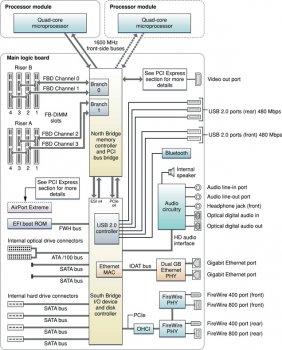
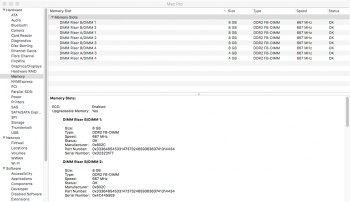
By the way - if you wish to utilize the maximum memory performance using 56GB (6x 8GB and 2x 4GB) in the 3,1, install the 2x 4GB modules in memory slots A3/A4 on Riser A as Riser B should be maxed out with the 8GB sticks due to the fact that it is assigned branch 0 in the north bridge memory controller and Riser A is assigned branch 1 - see attached diagram and screenshot of system information/memory.

Results: 11000+ MB/s fill rates and 6000+ MB/s copy rates which I wasn't able to achieve with any other combination amounting to 56GB.

071168001313_01.jpg 2015-12-13_08-33-25.png
 
Hi W1SS,
I have followed your instructions for installing 56GB of Ram in my MacPro 3,1 and everything is working. Thanks!

You mention the "vm_compressor=2 set in nvram (swap disabled)". Is this a requirement and if so how do I go about activating it. I'm guessing through the Terminal but I don't know how to go about it. Any help would be greatly appreciated.
This is where I'm at now.
Screen Shot 2016-01-04 at 4.21.15 PM.png
 
Hi,
I currently have 28GB of DDR2-800 FB-DIMM on my 3,1 MP, and am considering going up to 64GB@667Mhz. I have an SSD through an OWC Accelsior S card - can other people confirm going up to 64GB slows down PCIe SSD cards?
 
I can only confirm that there is evidence and wide consensus - as far as the MP is a 4- or 8-core type are concerned like with your MP) . 12-cores seem to work fine with all 8 slots full of RAM, 6-cores with 4 full slots.

If I recall correctly, even the position of the empty slots is important, not only to have two of them free of RAM. And - again: If I recall correctly - for the first MP it is different from 4,1/5,1 MP (different architecture)

But you should be capable to do the test yourself: Change the positions and run each time a performance-test.

(Ok, I know this will result in a LOT of tests… but with a little chance….)
 
Register on MacRumors! This sidebar will go away, and you'll see fewer ads.