Hello
I am Samuel Van Ransbeeck and I am a student of composition. My mathematics are really bad because i didn't study it long time. Anyway, I need some help for a new piece. I use a cellular automaton (rule 57) to control the spectrum of a chord. Now I want to control the entrance of the different notes/ frequencies of the spectrum based on the angle of a lineair function. Every generation would last 10 seconds and every generation the angle evolves more and more towards 45 degrees. So in the beginning, the notes are played at t= 0 which will be one chord. The further you go in the piece, the more smeared in time the chord becomes, like an arpeggio.
Now I need to have a way of looking to these values at a precise scale. I was thinking of something in excell or so. But as
1) my math knowledge is quite bad and
2) I don't really have the skills to program this
I thought asking it here.
Anyway, this is what i need:
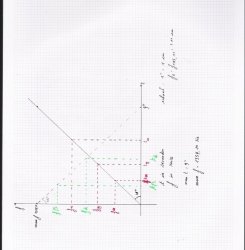
For example: at time t= 0,52 seconds, frequency f = 440 Hz which is an A4
So if i give in the frequency, should be able to see at wath time it will come.
The frequencies are fixed (I know those numbers), the time of every generation is 10 seconds, when the angle is 45 degrees, the highest frequency should enter in the end of these 10 seconds.
I also want to turn the thing upside down, so the highest frequency enters first and the lowest as the last one, it's all in the image I uploaded.
Here is an image of what I want (an image says more then 1000 words ;-) )
http://rapidshare.com/files/13626425...scan.tiff.html
I hope someone can help me, anyway
thanks in advance
Samuel

I am Samuel Van Ransbeeck and I am a student of composition. My mathematics are really bad because i didn't study it long time. Anyway, I need some help for a new piece. I use a cellular automaton (rule 57) to control the spectrum of a chord. Now I want to control the entrance of the different notes/ frequencies of the spectrum based on the angle of a lineair function. Every generation would last 10 seconds and every generation the angle evolves more and more towards 45 degrees. So in the beginning, the notes are played at t= 0 which will be one chord. The further you go in the piece, the more smeared in time the chord becomes, like an arpeggio.
Now I need to have a way of looking to these values at a precise scale. I was thinking of something in excell or so. But as
1) my math knowledge is quite bad and
2) I don't really have the skills to program this
I thought asking it here.
Anyway, this is what i need:
For example: at time t= 0,52 seconds, frequency f = 440 Hz which is an A4
So if i give in the frequency, should be able to see at wath time it will come.
The frequencies are fixed (I know those numbers), the time of every generation is 10 seconds, when the angle is 45 degrees, the highest frequency should enter in the end of these 10 seconds.
I also want to turn the thing upside down, so the highest frequency enters first and the lowest as the last one, it's all in the image I uploaded.
Here is an image of what I want (an image says more then 1000 words ;-) )
http://rapidshare.com/files/13626425...scan.tiff.html
I hope someone can help me, anyway
thanks in advance
Samuel