Become a MacRumors Supporter for $50/year with no ads, ability to filter front page stories, and private forums.

Jolio

macrumors newbie
Original poster
Oct 21, 2013
19
4
I bought a used 2009 Mac Pro a few weeks ago. I performed a clean installation of Yosemite and began using it as my primary machine. It seemed to work perfectly, for about a week, before I ran into this issue:

As I was browsing the internet, the cursor froze, I could get no response from the keyboard, and then after about 30 seconds, the machine powered off and restarted. The startup chime sounded garbled, and I was greeted with this:
panic.png

and, upon booting into OSX, this:
shut_down.png

(This second one, perhaps not exactly this message, I'm going from memory here)

I chose "Open", and everything came back up, including the browser, which I used immediately to begin researching the problem. One or two minutes later, as I was reading this Apple support page, the problem recurred. This time, however, I did not receive the same "Your computer restarted..." message; it went straight to the "progress bar" OS loading screen, but the bar only moved slightly and then stopped for several minutes. I hard restarted the machine, and now could get no display at all. I powered it off and unplugged it, thinking I would troubleshoot it the following day...which I set about to do, but now could not reproduce the problem. It started immediately up without issue.

I ran ASD on it and everything* passed. Hoping it was a random, one-time thing, I continued to use the computer...for about a week, before it happened again. Same situation, for the most part. Slight differences (no "Your computer restarted..." message, no boot into OSX at all immediately after the first restart, no panic log that I could find), but essentially the same: it froze, restarted, hung on the loading bar screen, I hard restarted, it would not display at all, I let it sit for a few days, and it booted up again, no problem.

I'm at a loss; please help me figure out what's going on here. Following is the kernel panic log from the first event, I can't seem to find any from the subsequent events:

Mon Aug 17 19:42:55 2015

*** Panic Report ***
Machine-check capabilities: 0x0000000000001c09
family: 6 model: 26 stepping: 5 microcode: 17
signature: 0x106a5
Intel(R) Xeon(R) CPU W3520 @ 2.67GHz
9 error-reporting banks
panic(cpu 7 caller 0xffffff8009c186ba): "Machine Check at 0xffffff7f8bd87242, registers:\n" "CR0: 0x000000008001003b, CR2: 0x0000000104e2e000, CR3: 0x000000000c920000, CR4: 0x0000000000002660\n" "RAX: 0x0000000000000020, RBX: 0xffffff801883a000, RCX: 0x0000000000000001, RDX: 0x0000000000000000\n" "RSP: 0xffffff80da9a3d40, RBP: 0xffffff80da9a3d70, RSI: 0x0000000000000006, RDI: 0xffffff80183b7900\n" "R8: 0x0000000000000000, R9: 0x000013fd542a849a, R10: 0x0000000000000000, R11: 0x00000000e0000000\n" "R12: 0x0000000000000006, R13: 0xffffff801834f6c0, R14: 0x00000000000007b0, R15: 0xffffff7f8bda3e20\n" "RFL: 0x0000000000000046, RIP: 0xffffff7f8bd87242, CS: 0x0000000000000008, SS: 0x0000000000000010\n" "Error code: 0x0000000000000000\n"@/SourceCache/xnu/xnu-2782.30.5/osfmk/i386/trap_native.c:168
Backtrace (CPU 7), Frame : Return Address
0xffffff80d48fde90 : 0xffffff8009b2bda1
0xffffff80d48fdf10 : 0xffffff8009c186ba
0xffffff80d48fe070 : 0xffffff8009c3541f
0xffffff80da9a3d70 : 0xffffff7f8bd7f1e9
0xffffff80da9a3e60 : 0xffffff7f8bd7e5b4
0xffffff80da9a3f20 : 0xffffff8009c1985e
0xffffff80da9a3f40 : 0xffffff8009b42e6b
0xffffff80da9a3f90 : 0xffffff8009b433b0
0xffffff80da9a3fb0 : 0xffffff8009c125b7
Kernel Extensions in backtrace:
com.apple.driver.AppleIntelCPUPowerManagement(218.0)[060D1763-7117-3950-B83F-5AEAAD2027DA]@0xffffff7f8bd7c000->0xffffff7f8bda6fff

BSD process name corresponding to current thread: kernel_task

Mac OS version:
14E46

Kernel version:
Darwin Kernel Version 14.4.0: Thu May 28 11:35:04 PDT 2015; root:xnu-2782.30.5~1/RELEASE_X86_64
Kernel UUID: E3C26B2F-8B97-3F1D-B193-690F7E34F830
Kernel slide: 0x0000000009800000
Kernel text base: 0xffffff8009a00000
__HIB text base: 0xffffff8009900000
System model name: MacPro4,1 (Mac-F221BEC8)

System uptime in nanoseconds: 21995557377735
last loaded kext at 16660373240064: com.apple.driver.AppleUSBCDC 4.3.3b1 (addr 0xffffff7f8c22a000, size 20480)
last unloaded kext at 16807003735185: com.apple.driver.AppleUSBCDC 4.3.3b1 (addr 0xffffff7f8c22a000, size 16384)
loaded kexts:
com.apple.filesystems.smbfs 3.0.1
com.apple.driver.AppleHWSensor 1.9.5d0
com.apple.driver.AppleTyMCEDriver 1.0.2d2
com.apple.driver.AGPM 110.19.6
com.apple.filesystems.autofs 3.0
com.apple.iokit.IOBluetoothSerialManager 4.3.5f8
com.apple.driver.AppleOSXWatchdog 1
com.apple.driver.AppleMikeyHIDDriver 124
com.apple.driver.AppleHDA 272.18.1
com.apple.driver.AppleMikeyDriver 272.18.1
com.apple.driver.AppleUpstreamUserClient 3.6.1
com.apple.driver.AppleMCCSControl 1.2.12
com.apple.GeForceTesla 10.0.0
com.apple.iokit.BroadcomBluetoothHostControllerUSBTransport 4.3.5f8
com.apple.driver.AudioAUUC 1.70
com.apple.driver.ACPI_SMC_PlatformPlugin 1.0.0
com.apple.driver.AppleLPC 1.7.3
com.apple.iokit.IOUserEthernet 1.0.1
com.apple.Dont_Steal_Mac_OS_X 7.0.0
com.apple.driver.AppleHWAccess 1
com.apple.driver.AppleHV 1
com.apple.driver.AppleIntelSlowAdaptiveClocking 4.0.0
com.apple.driver.AppleUSBDisplays 372.1
com.apple.driver.XsanFilter 404
com.apple.iokit.IOAHCIBlockStorage 2.7.1
com.apple.AppleFSCompression.AppleFSCompressionTypeDataless 1.0.0d1
com.apple.AppleFSCompression.AppleFSCompressionTypeZlib 1.0.0
com.apple.BootCache 36
com.apple.iokit.SCSITaskUserClient 3.7.5
com.apple.driver.AppleUSBHub 705.4.2
com.apple.driver.AppleFWOHCI 5.5.2
com.apple.driver.AirPort.Brcm4331 800.20.24
com.apple.driver.Intel82574L 2.6.8b1
com.apple.driver.AppleAHCIPort 3.1.2
com.apple.driver.AppleUSBEHCI 705.4.14
com.apple.driver.AppleUSBUHCI 656.4.1
com.apple.driver.AppleRTC 2.0
com.apple.driver.AppleHPET 1.8
com.apple.driver.AppleACPIButtons 3.1
com.apple.driver.AppleSMBIOS 2.1
com.apple.driver.AppleACPIEC 3.1
com.apple.driver.AppleAPIC 1.7
com.apple.driver.AppleIntelCPUPowerManagementClient 218.0.0
com.apple.nke.applicationfirewall 161
com.apple.security.quarantine 3
com.apple.security.TMSafetyNet 8
com.apple.driver.AppleIntelCPUPowerManagement 218.0.0
com.apple.AppleGraphicsDeviceControl 3.10.24
com.apple.kext.triggers 1.0
com.apple.iokit.IOSerialFamily 11
com.apple.driver.DspFuncLib 272.18.1
com.apple.kext.OSvKernDSPLib 1.15
com.apple.driver.AppleSMBusController 1.0.13d1
com.apple.nvidia.classic.NVDANV50HalTesla 10.0.0
com.apple.nvidia.classic.NVDAResmanTesla 10.0.0
com.apple.iokit.IOBluetoothHostControllerUSBTransport 4.3.5f8
com.apple.iokit.IOFireWireIP 2.2.6
com.apple.driver.IOPlatformPluginLegacy 1.0.0
com.apple.driver.AppleSMBusPCI 1.0.12d1
com.apple.driver.IOPlatformPluginFamily 5.9.1d7
com.apple.driver.AppleHDAController 272.18.1
com.apple.iokit.IOHDAFamily 272.18.1
com.apple.iokit.IOUSBUserClient 705.4.0
com.apple.iokit.IONDRVSupport 2.4.1
com.apple.iokit.IOSurface 97.4
com.apple.iokit.IOGraphicsFamily 2.4.1
com.apple.iokit.IOBluetoothFamily 4.3.5f8
com.apple.driver.AppleSMC 3.1.9
com.apple.iokit.IOSlowAdaptiveClockingFamily 1.0.0
com.apple.driver.AppleUSBHIDKeyboard 176.2
com.apple.driver.AppleHIDKeyboard 176.2
com.apple.iokit.IOUSBHIDDriverPM 710.4.7
com.apple.driver.AppleUSBAudio 295.23
com.apple.iokit.IOAudioFamily 203.3
com.apple.vecLib.kext 1.2.0
com.apple.iokit.IOUSBHIDDriver 705.4.0
com.apple.driver.AppleUSBMergeNub 705.4.0
com.apple.driver.AppleUSBComposite 705.4.9
com.apple.iokit.IOSCSIMultimediaCommandsDevice 3.7.5
com.apple.iokit.IOBDStorageFamily 1.7
com.apple.iokit.IODVDStorageFamily 1.7.1
com.apple.iokit.IOCDStorageFamily 1.7.1
com.apple.iokit.IOAHCISerialATAPI 2.6.1
com.apple.iokit.IOSCSIArchitectureModelFamily 3.7.5
com.apple.iokit.IOFireWireFamily 4.5.7
com.apple.iokit.IO80211Family 730.60
com.apple.iokit.IONetworkingFamily 3.2
com.apple.iokit.IOAHCIFamily 2.7.5
com.apple.iokit.IOUSBFamily 720.4.4
com.apple.driver.AppleEFINVRAM 2.0
com.apple.driver.AppleEFIRuntime 2.0
com.apple.iokit.IOHIDFamily 2.0.0
com.apple.iokit.IOSMBusFamily 1.1
com.apple.security.sandbox 300.0
com.apple.kext.AppleMatch 1.0.0d1
com.apple.driver.AppleKeyStore 2
com.apple.driver.AppleMobileFileIntegrity 1.0.5
com.apple.driver.AppleCredentialManager 1.0
com.apple.driver.DiskImages 397
com.apple.iokit.IOStorageFamily 2.0
com.apple.iokit.IOReportFamily 31
com.apple.driver.AppleFDEKeyStore 28.30
com.apple.driver.AppleACPIPlatform 3.1
com.apple.iokit.IOPCIFamily 2.9
com.apple.iokit.IOACPIFamily 1.4
com.apple.kec.Libm 1
com.apple.kec.pthread 1
com.apple.kec.corecrypto 1.0

System Profile:
Graphics: NVIDIA GeForce GT 120, NVIDIA GeForce GT 120, PCIe, 512 MB
AirPort: spairport_wireless_card_type_airport_extreme (0x14E4, 0x8E), Broadcom BCM43xx 1.0 (5.106.98.100.24)
Bluetooth: Version 4.3.5f8 15969, 3 services, 19 devices, 1 incoming serial ports
PCI Card: NVIDIA GeForce GT 120, Display Controller, Slot-1
Thunderbolt Bus:
FireWire Device: built-in_hub, Up to 800 Mb/sec
Memory Module: DIMM 1, 2 GB, DDR3 ECC, 1066 MHz, 0x80AD, 0x484D54313235553742465238432D47372020
Memory Module: DIMM 2, 2 GB, DDR3 ECC, 1066 MHz, 0x80AD, 0x484D54313235553742465238432D47372020
Memory Module: DIMM 3, 2 GB, DDR3 ECC, 1066 MHz, 0x80AD, 0x484D54313235553742465238432D47372020
USB Device: Hub
USB Device: Keyboard Hub
USB Device: Apple Keyboard
USB Device: Razer 1600dpi Mouse
USB Device: Hub
USB Device: Display Audio
USB Device: Apple LED Cinema Display
USB Device: Display iSight
USB Device: BRCM2046 Hub
USB Device: Bluetooth USB Host Controller
Serial ATA Device: HL-DT-ST DVD-RW GH41N
Serial ATA Device: Hitachi HDE721010SLA330, 1 TB
Network Service: Ethernet 1, Ethernet, en0
Model: MacPro4,1, BootROM MP41.0081.B08, 4 processors, Quad-Core Intel Xeon, 2.66 GHz, 6 GB, SMC 1.39f5

*everything except for something to do with the Ethernet MAC address, which I haven't quite figured out; I suspect may be a false positive, and don't believe is relevant here. If you think it is, I'll provide the details.
 
Last edited:

Jolio

macrumors newbie
Original poster
Oct 21, 2013
19
4
I'm fairly sure (not 100% positive) that both times, once I was unable to get any display, I did in fact unplug it for at least fifteen seconds before trying once again to restart the machine, and this didn't have any effect. I will be sure to do this, as well as the Shift-Control-Option method, if the problem recurs, but I don't think the SMC is the problem here.

Any other ideas? Can anyone give insight into my panic report?
 

satcomer

Suspended
Feb 19, 2008
9,115
1,976
The Finger Lakes Region
Maybe you could download the free software EtreCheck. It will scan and report on all the services, programs, etc and print out a text fike show all this files and the ones that not compatible so you can Manually Delete this file. Just reboot if you delete sevices!
 

Jolio

macrumors newbie
Original poster
Oct 21, 2013
19
4
It's happening again.

Froze, automatically restarted after about 30 seconds.

Garbled startup chime, displays blank grey screen, no change after 5 minutes.

I hard powered it off, unplugged it for 60 seconds (to reset SMC), and plug it back in.

It automatically powers on, garbled startup chime, displays grey screen with Apple icon and loading bar...but the loading bar doesn't fill at all, no change after 5 minutes.

I hard power it off again, attempt to simultaneously press Shift+Control+Option+Power. Not sure if I hit it successfully, but it does power on.

This time, no startup chime at all, no display at all. Hard power off and try the key combination again. Same thing: no startup chime at all, no display at all.

Hard power off and unplug for 60 seconds. Plug it back in, automatically powers on, but still: no startup chime at all, no display at all.

Unplug, guess I'll wait. Chances are it'll power up with no problem tomorrow.
 

Kissmyne

macrumors 6502
Apr 21, 2015
354
48
What happens when you try to start your computer with your hard drive unplugged(Is the chime clean sounding rather garbled? Does it stop at a No Boot Disk or Recovery Screen etc..)? Do you have another HDD hanging around? Are the HDD connections snug? Are all unnecessary peripherals(to boot) unplugged from the machine? Have you done a PRAM(NVRAM) reset?
 

Jolio

macrumors newbie
Original poster
Oct 21, 2013
19
4
What happens when you try to start your computer with your hard drive unplugged(Is the chime clean sounding rather garbled? Does it stop at a No Boot Disk or Recovery Screen etc..)?/QUOTE]

I'll try that next time, since it's back up and running today.

Do you have another HDD hanging around?

Yes. What are you thinking? Reinstall on that, see if the problem recurs? I will if I have to, I'm hoping it won't come to that.

Are the HDD connections snug? Are all unnecessary peripherals(to boot) unplugged from the machine?

The HDD seems to be properly in place, but I just now removed it, cleaned the contacts with compressed air and reseated it just in case. Nothing connected to the outside of the machine except the display, keyboard, and mouse; the inside is stock, except for the HDD.

Have you done a PRAM(NVRAM) reset?

Just now. I can't do one when the problem occurs, if I can't get a startup chime.
 

CoastalOR

macrumors 68040
Jan 19, 2015
3,028
1,149
Oregon, USA
Ref: PRAM(NVRAM) reset. Just now. I can't do one when the problem occurs, if I can't get a startup chime.
Do it anyway. I had a situation where I was not getting any startup chime. Per Apples Support direction they said do the NVRAM reset (Command-Option-P-R) and the chime returned. I held the keys down and waited until I heard the chime 3 times.

Just in case you have not seen these Apple pages.
Startup key combinations:
https://support.apple.com/en-us/HT201255
Apple NVRAM info:
https://support.apple.com/en-us/HT204063
 
Last edited:

OldGuyTom

macrumors regular
Sep 6, 2013
156
33
US
If possible I'd take the HD out of the interior and put it into an external enclosure and boot from that to see if the problem goes away. The 2009 units are known to have SATA cables that like to fail erratically. If they did so during a kernel read or write event it might produce what you're describing. That type of problem is erratic in nature.

I had an external drive with a faulty cable some time ago. I got a copy of Scannerz to test it because it can check for a lot of hardware stuff. The drive being tested was new and I expected Scannerz to find bad sectors and then I could send WD the report and say "See…the new HD is bad" but instead it found cable problems. I replaced the cable and the problem went away.

If the problems continued with the drive removed from then it's either the logic board or a bug somewhere in the software or maybe something that's loaded at boot time. Have you tried running it in Safe Mode? Do you have the latest version of Yosemite? It was hardly bug free, but they got a lot of them fixed. You might also want to reseat the RAM just as a precaution.

Good Luck.
 
  • Like
Reactions: CoastalOR

Jolio

macrumors newbie
Original poster
Oct 21, 2013
19
4
Problem occurred again last night. It's getting more frequent.

Froze, automatically restarted, no display and no chime. Powered off and reseated the RAM and the processor board. Boots and chimes normally, but after a few minutes, the display started flashing (link to video). This is a new thing.

I unplugged the mini-DP cable from the back and plugged it back in, but the display would not come back up at all. Thinking I should have tried to see, before unplugging the display cable, if the system was responsive at all, or frozen, I tried the sleep key combination, Command-Option-Power, but nothing happened.

I hard power it off and back on, garbled chime and blank grey screen.

Reseat video card, power on, normal chime, normal grey loading screen with apple logo and loading bar...bar moves slightly, stops, and then this:
IMG_0298.JPG


Hard power off, attempt PRAM reset...garbled startup sound, blank grey screen, no automatic restart.

Hard power off, replaced video card with an old Radeon HD 2600 XT I had from a 2008 MP, but now there's no chime and no display.

Restarted three times, each with a different single RAM stick, but each time, no chime and no display.

Today, of course, it starts up fine with the 2600 XT, and runs fine (for now).
 

Jolio

macrumors newbie
Original poster
Oct 21, 2013
19
4
I'm going off my notes from last night...I thought I tried it with the HDD removed, and it made no difference, but...I'm not sure. I will definitely do it the next time.
 

Jolio

macrumors newbie
Original poster
Oct 21, 2013
19
4
Did someone upgrade the processors or does it have the original processors ?

There's only one processor, 2.66GHz, the lowest-end offering in this series; I have no reason to believe it isn't the original processor. Don't know for sure, though. Why do you ask?
 

Plutonius

macrumors G3
Feb 22, 2003
9,168
8,755
New Hampshire, USA
There's only one processor, 2.66GHz, the lowest-end offering in this series; I have no reason to believe it isn't the original processor. Don't know for sure, though. Why do you ask?

Reading through the hardware forum, you sometimes see issues with the 4,1 Mac Pro when someone botches a processor upgrade.

Seeing as you have the original processor, I'm not sure what your problem is. Could it be your power supply ?
 

ZVH

macrumors 6502
Apr 14, 2012
381
51
If I had to guess I'd say it's an intermittent short somewhere or a supply problem. The way the video is blanking out indicates there's intermittent power loss to the video card, causing it to drop it's output intermittently. The only thing I could suggest is to remove as many items plugged into the unit as possible, re-seat the remaining items, restart the system, see if it works. If it works, start plugging other stuff in one by one. This would include all I/O connections too. If it doesn't it's most likely the supply or the board. I wouldn't rule out the other possibilities others have suggested about it being a botched processor upgrade, but if it was that I'd think it would have been doing this all the time. Almost anything plugged into the unit including the video card could be failing intermittently.
 

Jolio

macrumors newbie
Original poster
Oct 21, 2013
19
4
No change with the HDD removed. No change with different RAM configurations.

Why does this problem only happen after several hours of use?

Why does it clear up after 12-24 hours of disuse?
 

ZVH

macrumors 6502
Apr 14, 2012
381
51
No change with the HDD removed. No change with different RAM configurations.

Why does this problem only happen after several hours of use?

Why does it clear up after 12-24 hours of disuse?

I would personally suspect it's heat related, which could be the supply, the CPU cooling, or the system cooling, or a component that's starting to fail as it heats up.

On at least some of the older BSD operating systems (OS X is a variant) if the CPU temperature got too hot the OS would throttle the CPU down to lower use, causing the system to bottleneck, but not crash. This would be recorded in the log files. Unfortunately, I've never seen any such logging messages showing up in OS X, so apparently for some reason they took them out. IMHO the most likely cause would be one of the output stages of the supply because the logic board has sensors that should shut the thing down or (I'd think) at least warn you and/or log the event. No such monitoring is on the power supply to the best of my knowledge, especially if the problem is limited to only one of the several output lines.

You might want to look at the log files, especially system.log (/var/log/system.log) and see if right before the crashes there were any messages generated about temperature or some component being out of whack. It might tell you something, but if it's from the power supply, likely nothing will show up.

UPDATE:
I just looked at the white screen photo in detail. The line in the backtrace is referring to the CPU power management, FWIW, so something may be logged if you're lucky.
 

Jolio

macrumors newbie
Original poster
Oct 21, 2013
19
4
I've got little doubt it's heat related. Some component is failing once it comes up to a certain temperature, and resuming normal operation once fully cooled.

I don't believe it's one of the major components overheating, either. I had Hardware Monitor running during the last crash, and the final temperature readings are:

Time......2015-09-05 20:53:07 +0000
SMART Disk Hitachi HDE721010SLA330......40
Ambient Air......31
CPU A Temperature Diode......53
CPU A Heatsink......48
Hard Drive Bay 1......32
Hard Drive Bay 2......33
Hard Drive Bay 3......34
Hard Drive Bay 4......33
Memory Module Slot 1......42
Memory Module Slot 2......43
Memory Module Slot 3......43
Northbridge Chip......55
Northbridge Heat Sink......46
PCIe Slot 1......65
Power Supply Location 1......38
Power Supply Location 2......38

I also have a history temperature as well as fan speed, voltage, current, and power readings, if they would be helpful. I did notice a large dip in power, temperature, and current readings about ten minutes before the crash; I'm not sure if this means anything, it may just have been due to reduced demand. The voltages never fluctuated.

I had a look at the system.log files; I've got six crashes on file now. I'm no expert at reading these logs, and while I do see some errors and warnings, there's nothing consistent or that seems related to heat or power. What I did notice that seemed a bit odd is that immediately after each crash, the time resets to Dec 31 19:00:10. Does this mean anything to you?

I really wish I had access to a known-good PSU and CPU/RAM/tray.

Following are excerpts from each log, including the time of the crash and a few lines prior:

Aug 31 18:55:12 My-Mac-Pro.local nsurlstoraged[218]: realpath() returned NULL for /var/root/Library/Caches/ocspd

Aug 31 18:55:12 My-Mac-Pro.local nsurlstoraged[218]: The read-connection to the DB=/var/root/Library/Caches/ocspd/Cache.db is NOT valid. Unable to determine schema version.

Aug 31 18:55:12 My-Mac-Pro.local nsurlstoraged[218]: realpath() returned NULL for /var/root/Library/Caches/ocspd

Aug 31 18:55:12 --- last message repeated 1 time ---

Aug 31 18:55:12 My-Mac-Pro.local nsurlstoraged[218]: ERROR: unable to determine file-system usage for FS-backed cache at /var/root/Library/Caches/ocspd/fsCachedData. Errno=13

Dec 31 19:00:10 localhost bootlog[0]: BOOT_TIME 978307210 0


Sep 1 18:02:29 My-Mac-Pro kernel[0]: process rpcsvchost[142] thread 1038 caught burning CPU!; EXC_RESOURCE supressed due to audio playback

Sep 1 18:03:30 My-Mac-Pro.local warmd[53]: [_bootcachectl_playlist_for_file:3202] Unable to generate playlist for file: 2 No such file or directory

Sep 1 18:03:34 --- last message repeated 1 time ---

Sep 1 18:03:34 My-Mac-Pro.local CoreServicesUIAgent[292]: unexpected message <OS_xpc_error: <error: 0x7fff7c7fdc60> { count = 1, contents =

"XPCErrorDescription" => <string: 0x7fff7c7fdf70> { length = 18, contents = "Connection invalid" }

}>

Sep 1 18:03:34 --- last message repeated 1 time ---

Sep 1 18:03:34 My-Mac-Pro.local WindowServer[138]: CGXGetConnectionProperty: Invalid connection 45447

Sep 1 18:03:34 --- last message repeated 5 times ---

Sep 1 18:03:34 My-Mac-Pro.local loginwindow[86]: Login Window point of no return

Sep 1 18:03:34 My-Mac-Pro com.apple.xpc.launchd[1] (com.apple.coreservices.uiagent[292]): Service exited due to signal: Killed: 9

Sep 1 18:03:34 My-Mac-Pro com.apple.xpc.launchd[1] (com.apple.AirPlayUIAgent[280]): Service exited due to signal: Killed: 9

Sep 1 18:03:34 My-Mac-Pro.local sharingd[283]: 18:03:34.725 : SIGTERM received, shutting down.

Sep 1 18:03:34 My-Mac-Pro com.apple.xpc.launchd[1] (com.apple.internetaccounts[319]): Service exited due to signal: Killed: 9

Sep 1 18:03:34 My-Mac-Pro com.apple.xpc.launchd[1] (com.apple.lateragent[411]): Service exited due to signal: Killed: 9

Sep 1 18:03:34 My-Mac-Pro com.apple.xpc.launchd[1] (com.apple.iTunesHelper.46324[360]): Service exited with abnormal code: 1

Sep 1 18:03:34 My-Mac-Pro com.apple.xpc.launchd[1] (com.apple.cloudphotosd[375]): Service exited due to signal: Killed: 9

Sep 1 18:03:34 My-Mac-Pro.local sessionlogoutd[443]: sessionlogoutd Launched

Sep 1 18:03:34 My-Mac-Pro.local sessionlogoutd[443]: DEAD_PROCESS: 86 console

Sep 1 18:03:34 My-Mac-Pro.local shutdown[444]: halt by joelcahoon:

Sep 1 18:03:34 My-Mac-Pro kernel[0]: Kext loading now disabled.

Sep 1 18:03:34 My-Mac-Pro kernel[0]: Kext unloading now disabled.

Sep 1 18:03:34 My-Mac-Pro kernel[0]: Kext autounloading now disabled.

Sep 1 18:03:34 My-Mac-Pro kernel[0]: Kernel requests now disabled.

Sep 1 18:03:34 My-Mac-Pro.local shutdown[444]: SHUTDOWN_TIME: 1441145014 955459

Sep 1 18:03:34 My-Mac-Pro com.apple.xpc.launchd[1] (com.apple.xpc.launchd.domain.system): System reboot initiated by: shutdown.444<-sessionlogoutd.443<-launchd.1

Sep 1 18:03:34 My-Mac-Pro.local com.apple.SecurityServer[73]: Killing auth hosts

Sep 1 18:03:34 --- last message repeated 3 times ---

Sep 1 18:03:34 My-Mac-Pro.local loginwindow[86]: ERROR | SLODErrorHandler | Connection to sessionlogoutd lost, exiting loginwindow

Dec 31 19:00:10 localhost bootlog[0]: BOOT_TIME 978307210 0


Sep 1 19:53:41 My-Mac-Pro.local nsurlstoraged[209]: realpath() returned NULL for /var/root/Library/Caches/ocspd

Sep 1 19:53:41 My-Mac-Pro.local nsurlstoraged[209]: The read-connection to the DB=/var/root/Library/Caches/ocspd/Cache.db is NOT valid. Unable to determine schema version.

Sep 1 19:53:41 My-Mac-Pro.local nsurlstoraged[209]: realpath() returned NULL for /var/root/Library/Caches/ocspd

Sep 1 19:53:41 --- last message repeated 1 time ---

Sep 1 19:53:41 My-Mac-Pro.local nsurlstoraged[209]: ERROR: unable to determine file-system usage for FS-backed cache at /var/root/Library/Caches/ocspd/fsCachedData. Errno=13

Sep 1 19:53:44 My-Mac-Pro kernel[0]: Google Chrome He (map: 0xffffff8027fdcd20) triggered DYLD shared region unnest for map: 0xffffff8027fdcd20, region 0x7fff96a00000->0x7fff96c00000. While not abnormal for debuggers, this increases system memory footprint until the target exits.

Sep 1 20:00:10 My-Mac-Pro com.apple.xpc.launchd[1] (com.apple.imfoundation.IMRemoteURLConnectionAgent): The _DirtyJetsamMemoryLimit key is not available on this platform.

Sep 1 20:00:11 My-Mac-Pro com.apple.iCloudHelper[441]: objc[441]: Class FALogging is implemented in both /System/Library/PrivateFrameworks/FamilyCircle.framework/Versions/A/FamilyCircle and /System/Library/PrivateFrameworks/FamilyNotification.framework/Versions/A/FamilyNotification. One of the two will be used. Which one is undefined.

Sep 1 20:00:11 My-Mac-Pro com.apple.xpc.launchd[1] (com.apple.imfoundation.IMRemoteURLConnectionAgent): The _DirtyJetsamMemoryLimit key is not available on this platform.

Sep 1 20:00:41 --- last message repeated 1 time ---

Dec 31 19:00:13 localhost bootlog[0]: BOOT_TIME 978307213 0


Sep 1 20:17:47 My-Mac-Pro kernel[0]: Google Chrome He (map: 0xffffff801c120690) triggered DYLD shared region unnest for map: 0xffffff801c120690, region 0x7fff93800000->0x7fff93a00000. While not abnormal for debuggers, this increases system memory footprint until the target exits.

Sep 1 20:17:55 --- last message repeated 1 time ---

Sep 1 20:17:55 My-Mac-Pro kernel[0]: process rpcsvchost[146] thread 1084 caught burning CPU!; EXC_RESOURCE supressed due to audio playback

Sep 1 20:19:24 My-Mac-Pro kernel[0]: NVDA(OpenGL): Channel exception! exception type = 0x6 = DMA Engine Error (FIFO Error 6)

Sep 1 20:19:32 My-Mac-Pro.local mds[54]: (Volume.Normal:2464) volume:0x7fc403803000 ********** Bootstrapped Creating a default store:0 SpotLoc:(null) SpotVerLoc:(null) occlude:0 /Volumes/firmwaresyncd.6X0Uop

Sep 1 20:20:42 My-Mac-Pro kernel[0]: USB Sound assertion in AppleUSBAudioStream at line 4858

Sep 1 20:20:42 --- last message repeated 1 time ---

Sep 1 20:20:42 My-Mac-Pro kernel[0]: USB Sound assertion in AppleUSBAudioStream at line 4804

Dec 31 19:00:10 localhost bootlog[0]: BOOT_TIME 978307210 0


Sep 2 18:21:34 My-Mac-Pro.local com.apple.usbmuxd[72]: _SendAttachNotification Device e0:66:78:94:bd:f8@fe80::e266:78ff:fe94:bdf8._apple-mobdev2._tcp.local. has already appeared on interface 5. Suppressing duplicate attach notification.

Sep 2 18:22:13 My-Mac-Pro.local iTunes[281]: Entered:_AMMuxedDeviceDisconnected, mux-device:10

Sep 2 18:22:13 My-Mac-Pro.local iTunes[281]: Entered:__thr_AMMuxedDeviceDisconnected, mux-device:10

Sep 2 18:22:13 My-Mac-Pro.local iTunes[281]: tid:18c9f - Mux ID not found in mapping dictionary

Sep 2 18:22:13 My-Mac-Pro.local iTunes[281]: tid:18c9f - Can't handle disconnect with invalid ecid

Sep 2 18:24:22 My-Mac-Pro kernel[0]: Google Chrome He (map: 0xffffff801446f2d0) triggered DYLD shared region unnest for map: 0xffffff801446f2d0, region 0x7fff8fa00000->0x7fff8fc00000. While not abnormal for debuggers, this increases system memory footprint until the target exits.

Sep 2 18:24:23 My-Mac-Pro kernel[0]: Google Chrome He (map: 0xffffff801446f1e0) triggered DYLD shared region unnest for map: 0xffffff801446f1e0, region 0x7fff8fa00000->0x7fff8fc00000. While not abnormal for debuggers, this increases system memory footprint until the target exits.

Sep 2 18:24:24 My-Mac-Pro kernel[0]: Google Chrome He (map: 0xffffff80197e0a50) triggered DYLD shared region unnest for map: 0xffffff80197e0a50, region 0x7fff8fa00000->0x7fff8fc00000. While not abnormal for debuggers, this increases system memory footprint until the target exits.

Sep 2 18:25:53 My-Mac-Pro kernel[0]: hfs: mounted ASD OS 3S132 on device disk4s2

Sep 2 18:25:53 My-Mac-Pro.local mds[54]: (Volume.Normal:2464) volume:0x7fc062010000 ********** Bootstrapped Creating a default store:1 SpotLoc:(null) SpotVerLoc:(null) occlude:0 /Volumes/ASD OS 3S132

Sep 2 18:25:54 My-Mac-Pro kernel[0]: hfs: mounted ASD OS 3S132 on device disk1s2

Sep 2 18:25:54 My-Mac-Pro.local mds[54]: (Volume.Normal:2464) volume:0x7fc066020000 ********** Bootstrapped Creating a default store:3 SpotLoc:/Volumes/ASD OS 3S132 1/.Spotlight-V100 SpotVerLoc:/Volumes/ASD OS 3S132 1/.Spotlight-V100/Store-V1 occlude:0 /Volumes/ASD OS 3S132 1

Sep 2 18:25:57 My-Mac-Pro.local mds_stores[183]: (/Volumes/ASD OS 3S132 1/.Spotlight-V100/Store-V2/ED99EF84-35FF-4206-83B2-141CBF6F57A5)(Normal) IndexGeneral in int SICreateNewIndex(SIRef *, int, SIVolumeParams *, SIVolumeParams *, uint32_t, SIFileOps, SIIndexCallbacks *, SIPersistentIDStoreRef, int *):Creating New Index

Sep 2 18:26:05 My-Mac-Pro.local mdworker[3093]: (ImportBailout.Error:1325) Asked to exit for Diskarb

Sep 2 18:26:05 My-Mac-Pro.local mdworker[3196]: (ImportBailout.Error:1325) Asked to exit for Diskarb

Sep 2 18:26:05 My-Mac-Pro.local mdworker[3092]: (ImportBailout.Error:1325) Asked to exit for Diskarb

Sep 2 18:26:05 My-Mac-Pro.local mdworker[3197]: (ImportBailout.Error:1325) Asked to exit for Diskarb

Sep 2 18:26:05 My-Mac-Pro.local mdworker[3222]: (ImportBailout.Error:1325) Asked to exit for Diskarb

Sep 2 18:26:06 My-Mac-Pro.local mds[54]: (LSOF.Error:239) File '/Volumes/ASD OS 3S132 1/Applications/TextEdit.app/Contents/Resources/English.lproj/InfoPlist.strings' (fd=20) left open on device 16777222

Sep 2 18:26:06 My-Mac-Pro kernel[0]: hfs: unmount initiated on ASD OS 3S132 on device disk1s2

Sep 2 18:26:06 My-Mac-Pro.local mdworker[3224]: (ImportBailout.Error:1325) Asked to exit for Diskarb

Sep 2 18:26:07 My-Mac-Pro kernel[0]: hfs: unmount initiated on ASD OS 3S132 on device disk4s2

Sep 2 18:26:08 My-Mac-Pro com.apple.xpc.launchd[1] (com.apple.mdworker.shared.02000000-0000-0000-0000-000000000000): Service only ran for 2 seconds. Pushing respawn out by 8 seconds.


Sep 5 16:53:29 My-Mac-Pro kernel[0]: NVDA(OpenGL): Channel exception! exception type = 0xd = Graphics Engine Error (GR Error 5)

Sep 5 16:53:29 My-Mac-Pro kernel[0]: IOVendorGLContext::ReportGPURestart

Sep 5 16:53:45 My-Mac-Pro.local HardwareMonitor[1292]: _DPSDiscardEvents: FlushEventsMatchingListFromQueue returned error (-50)

Sep 5 16:54:18 --- last message repeated 4 times ---

Sep 5 16:54:36 My-Mac-Pro.local HardwareMonitor[1292]: _DPSDiscardEvents: FlushEventsMatchingListFromQueue returned error (-50)

Sep 5 16:54:44 My-Mac-Pro.local HardwareMonitor[1292]: _DPSDiscardEvents: FlushEventsMatchingListFromQueue returned error (-50)

Sep 5 16:55:17 --- last message repeated 2 times ---

Sep 5 16:55:17 My-Mac-Pro.local imagent[306]: <IMMacNotificationCenterManager: 0x7f9cb2b3b1e0>: notification observer: com.apple.FaceTime notification: __CFNotification 0x7f9cb290ec40 {name = _NSDoNotDisturbEnabledNotification}

Sep 5 16:55:17 My-Mac-Pro.local identityservicesd[299]: <IMMacNotificationCenterManager: 0x7fa130c36e60>: notification observer: com.apple.iChat notification: __CFNotification 0x7fa132304230 {name = _NSDoNotDisturbEnabledNotification}

Sep 5 16:55:17 My-Mac-Pro.local imagent[306]: <IMMacNotificationCenterManager: 0x7f9cb2b3b1e0>: NC Disabled: NO

Sep 5 16:55:17 My-Mac-Pro.local identityservicesd[299]: <IMMacNotificationCenterManager: 0x7fa130c36e60>: NC Disabled: NO

Sep 5 16:55:17 My-Mac-Pro.local identityservicesd[299]: <IMMacNotificationCenterManager: 0x7fa130c36e60>: DND Enabled: YES

Sep 5 16:55:17 My-Mac-Pro.local imagent[306]: <IMMacNotificationCenterManager: 0x7f9cb2b3b1e0>: DND Enabled: YES

Sep 5 16:55:17 My-Mac-Pro.local imagent[306]: <IMMacNotificationCenterManager: 0x7f9cb2b3b1e0>: Updating enabled: NO (Topics: (

))

Sep 5 16:55:17 My-Mac-Pro.local identityservicesd[299]: <IMMacNotificationCenterManager: 0x7fa130c36e60>: Updating enabled: NO (Topics: (

))

Sep 5 16:55:17 My-Mac-Pro.local identityservicesd[299]: <IMMacNotificationCenterManager: 0x7fa132113220>: notification observer: com.apple.iChat notification: __CFNotification 0x7fa130d37460 {name = _NSDoNotDisturbEnabledNotification}

Sep 5 16:55:17 My-Mac-Pro.local identityservicesd[299]: <IMMacNotificationCenterManager: 0x7fa132113220>: NC Disabled: NO

Sep 5 16:55:17 My-Mac-Pro.local identityservicesd[299]: <IMMacNotificationCenterManager: 0x7fa132113220>: DND Enabled: YES

Sep 5 16:55:17 My-Mac-Pro.local identityservicesd[299]: <IMMacNotificationCenterManager: 0x7fa132113220>: Updating enabled: NO (Topics: (

))

Dec 31 19:00:10 localhost bootlog[0]: BOOT_TIME 978307210 0
 
Last edited:

ZVH

macrumors 6502
Apr 14, 2012
381
51
I've got little doubt it's heat related. Some component is failing once it comes up to a certain temperature, and resuming normal operation once fully cooled.

I don't believe it's one of the major components overheating, either. I had Hardware Monitor running during the last crash, and the final temperature readings are:


I also have a history temperature as well as fan speed, voltage, current, and power readings, if they would be helpful. I did notice a large dip in power, voltage, and current readings about ten minutes before the crash; I'm not sure if this means anything, it may just have been due to reduced demand.

I had a look at the system.log files; I've got six crashes on file now. I'm no expert at reading these logs, and while I do see some errors and warnings, there's nothing consistent or that seems related to heat or power. What I did notice that seemed a bit odd is that immediately after each crash, the time resets to Dec 31 19:00:10. Does this mean anything to you?

I really wish I had access to a known-good PSU and CPU/RAM/tray.

Following are excerpts from each log, including the time of the crash and a few lines prior:


Voltage levels shouldn't be changing, or at least not much. The purpose of the regulator (supply) is to ensure that the voltage levels are stable as the current load changes. If something dropped from say 12V to 11.5V, it's probably not a big deal, but if it's something like going from 12V to 2V, that's entirely unacceptable and to me points at a malfunction. Possibly that's the way the supply on that works but I've never heard of such a thing.

I would do a web search on power supply problems with those units, particularly looking out for capacitor problems. For reference, you might want to look at this article:

https://en.wikipedia.org/wiki/Capacitor_plague

Although theoretically all those caps were effectively gone by 2007, I had an LCD display that I got in 2009 that did have some of those caps in them. The top of an electrolytic capacitor should be perfectly flat but if it's bloated upward like it is in some of the photos they show, it's bad.

FWIW on my monitor it would periodically, once in a while, fail to start until I pressed the button a few times. Then it got to the point when it would just blank out after hours of use. Finally it got to the point it wouldn't even turn on at all. I was going to replace the monitor but heard about the problem because it was somewhat rampant, opened the the thing up and sure enough, bloated caps (3 of them). I replaced them, fired the unit up, and it's been working fine ever since.

Unfortunately, you're looking at a lot of possibilities and you're really down to the point of isolating which component it is and then finding what's wrong with it once the main component is identified. Checking the caps can at least be done visually.

Good luck.
 

Jolio

macrumors newbie
Original poster
Oct 21, 2013
19
4
I did notice a large dip in power, temperature, and current readings about ten minutes before the crash; I'm not sure if this means anything, it may just have been due to reduced demand. The voltages never fluctuated.

There, fixed that, sorry.

I'll take a look at the logic board caps next time I've got the machine off, and the PSU caps if I can get to them without breaking a seal.

I ran a stress test on it yesterday, with the "yes" command on all cores, for nearly an hour; no freeze and shutdown. If it is heat-related, it must be one specific component...
 

Jolio

macrumors newbie
Original poster
Oct 21, 2013
19
4
Well, I decided to just tear it apart and have a look. I didn't see any bulging caps in the PSU, but I didn't take it apart. I just looked in from the outside, but the grating is so large I can see almost everything inside.

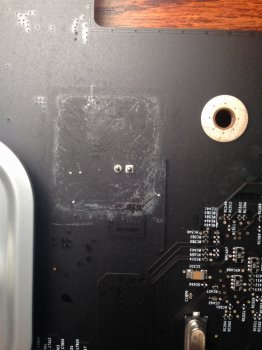
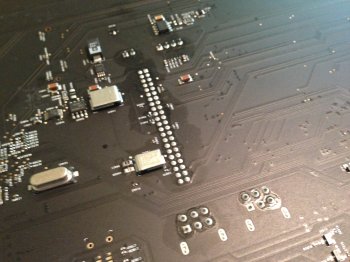
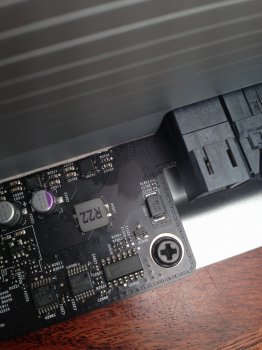
I took the motherboard (technically, the 'backplane board') out, and I see no bulging caps, but there are a few things I'm concerned about: white residue, marked caps, oily residue, and...something, see the pictures.

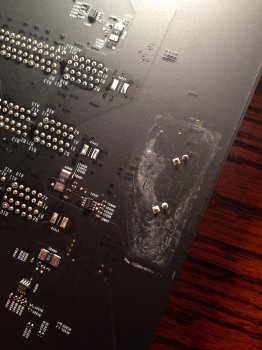
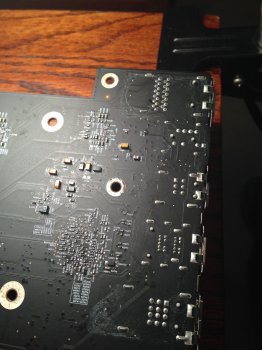
There's white residue in three places on the back of the backplane board:
One near the front...
white front.JPG

One near the PCIe x4 slots at the rear...
white back.JPG

And one large spot around the entire rear port area:
white back ports.JPG

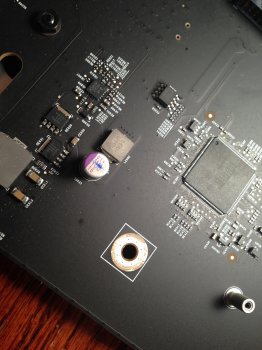
The first two spots are centered around capacitors on the front of the board. These caps, and only these three, have been marked with blue marker (why?); this is the one near the front:
caps.JPG

The third, larger white spot around the rear ports contains no caps that I can see, unless they're inside the port housings.

There's also some oily residue on many of the contacts on the back of the backplane board, including but not limited to: some, but not all, PCIe slot pins (not pictured); PCIe booster pins (pictured); front-panel-board-to-backplane-board-connector pins (pictured); processor cage fans (front pictured); speaker (pictured).
oily fpconn.JPG

There's also some oily residue on the processor tray, coming from under the heatsink near the thermal pad, by the connector to the backplane board. You can see where I smudged it:
oily processor.JPG

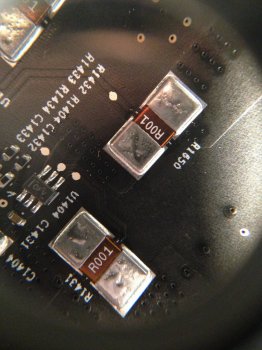
And finally, there is some sort of "blistering" or "bubbling" on one of the types of components. On the backside of the backplane board, near where the power supply connector plugs in, there are eight components labelled "R001", and each shows these features:

blistering.JPG

I'm hoping the oily residue is nothing to be worried about, perhaps solder flux, but I'm a little more worried by the white residue. It seems to take the shape of EM flux lines. I don't know what to think about the blistering components.
 

BradHatter

macrumors regular
Oct 7, 2014
191
13
Large caps, the type that go bad, will typically be found in the supply. Few if any of them will be on the logic board. If the supply faults while in use it's unlikely any monitoring software will catch it because the fault will reset the logic board and in doing so terminate that program. The problem is probably going to be heat or a capacitor intermittently zapping it's voltage levels on it's slow way to death. I'd try to find one of the service manuals for that thing on eBay (or wherever) because they would have a lot more detailed troubleshooting steps than you could possibly get from a message board like this.

Another thing you might want to try might be a free fan control program just to see if you could set the default fan speeds a little higher. Some of them are free. I'm not suggesting that as a solution but if the base fan speeds are upped a little and the problem goes away then you'll know it's heat related. Read the cautions about them as well.

Regarding the logic board stuff, I doubt that's anything but leftovers from board assembly.
 
Last edited:
Register on MacRumors! This sidebar will go away, and you'll see fewer ads.