Become a MacRumors Supporter for $50/year with no ads, ability to filter front page stories, and private forums.

broly

Suspended
Original poster
Apr 1, 2020
68
16
edmonton
hi,

so i have been using my machine quite heavily over the past 12 years.

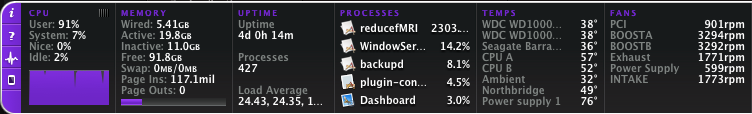
in the past 6 months or so, i have been running computations for a long time that often use all 12 cores and a good chunk of memory.

in the past few days i've noticed significant performance degradation (timing the completion of the computation).

one computation i would run in matlab, for example, would have the fans spinning at 100% until it completed, and it would usually return the desired data, followed by the fans slowing down shortly after.

now every time i run this computation, the fans spin for a bit but then slow down, and the MATLAB process is using only 100% (of 2400%) for a good 30-45 minutes afterwards before the function returns. this never used to happen.

and when i run a program in bash that uses intel's math kernel library, it has slowed down so bad.

my i9 9980 macbook pro (64 gigs ram) takes 1697 seconds, and my 5,1 is now taking 4223 seconds (!!)

even with the "massive" architectural differences and AVX, i don't think my mac pro should be slower than my macbook pro.

possible i fried or wore the interconnects or something?
 

broly

Suspended
Original poster
Apr 1, 2020
68
16
edmonton
Did you verified the temperatures while doing the computation for anything over the expected?

Did you already re-pasted the CPU thermal paste? If not the thermal paste is completely dry cement after 12 years.

Did you already replaced the CPU tray northbridge heatsink push-pins that break over time?

the temperatures are normal. nothing over 65, with the second cpu trailing behind by a few degrees.

yeah i did re-apply thermal paste in 2018 because i changed my E2400s to the X5690 xeons.

i did not change the push pins because when i inspected the board at that the time, everything looked good (first owner). those have not been touched
 

tsialex

Contributor
Jun 13, 2016
13,048
13,272

tsialex

Contributor
Jun 13, 2016
13,048
13,272
the temperatures are normal. nothing over 65, with the second cpu trailing behind by a few degrees.

yeah i did re-apply thermal paste in 2018 because i changed my E2400s to the X5690 xeons.

i did not change the push pins because when i inspected the board at that the time, everything looked good (first owner). those have not been touched

Next time you run, check the northbridge T-diode temperature, if you get over 75ºC, you have at least ineffective thermal paste or worse, a broken push-pin.
 

broly

Suspended
Original poster
Apr 1, 2020
68
16
edmonton
that's geekbench though, purely synthetic.

in these computations the advantage offered by AVX or other things is not that big.

earlier this month my machine was performing quite well and it only started happening recently.

is it possible to strain the connection path from the CPU board to the socket? something is going on.

especially for the MATLAB situation, where for a solid 30-45 minutes the machine is pretty much idle and MATLAB seems to be waiting for the machine to finish gathering the computation result (it's a 10^5 x 10^3 array of doubles, but the way its produced is quite taxing).

this never used to happen. i would know if it did, because i sit there waiting for it to finish.
 

broly

Suspended
Original poster
Apr 1, 2020
68
16
edmonton
Next time you run, check the northbridge T-diode temperature, if you get over 75ºC, you have at least ineffective thermal paste or worse, a broken push-pin.
i'm running it now but i don't see a northbridge temperature on istat pro, what do you use for temps?
 

tsialex

Contributor
Jun 13, 2016
13,048
13,272
i'm running it now but i don't see a northbridge temperature on istat pro, what do you use for temps?

iStat shows it:

Screen Shot 2024-04-29 at 14.40.26.png
 

broly

Suspended
Original poster
Apr 1, 2020
68
16
edmonton
oh they do, i just didn't use 'tall' to see it because i had all the memory banks reporting temperatures. completely forgot about that :p had to disable them.


here you go


everything looks good, right?
 

Attachments

  • Screen Shot 2024-04-29 at 11.43.06 AM.png
    Screen Shot 2024-04-29 at 11.43.06 AM.png
    68.4 KB · Views: 40

tsialex

Contributor
Jun 13, 2016
13,048
13,272
oh they do, i just didn't use 'tall' to see it because i had all the memory banks reporting temperatures. completely forgot about that :p had to disable them.


here you go


everything looks good, right?

At the end of the computation run, look the iStat graph for the last hour, see if there are any spikes.
 

broly

Suspended
Original poster
Apr 1, 2020
68
16
edmonton
i haven't seen that.

i swear the fans used to spin way harder during this computation. it seems like this thing isn't going full throttle. it used to be louder than that.

this sucks. something is up.
 

Elusi

macrumors regular
Oct 26, 2023
168
351
Sounds unlikely to me that a hardware fault would reduce load and not just bring you into plain kernel panic. I'm guessing something with your MATLAB config has changed. How, by who or what I don't know.

One thing that would point in this direction is if you do run geekbench, or perhaps preferably some older cinebench, and get the same score as all other Mac Pros of the same config. Then your Mac is performing as it should in a multicore stress scenario.
 

broly

Suspended
Original poster
Apr 1, 2020
68
16
edmonton
seems there is something up with my processors at least, two of the cores seem to have way lower temps than the others.

and the IPC seems very low.
mwe2.gif

Screen Shot 2024-04-29 at 12.15.45 PM.png

edit: i don't have geekbench. i run osx 10.14. i also am not sure if geekbench will do what i need it to do. please do not get hung up on synthetic benchmarks. when you're doing matrix computations there is some advantage, yes, to having avx and a newer architecture, but it doesn't scale the way you think.

similarly the key for my computations is the L2 and L3 hits, as there is little other benefit afforded by the speculative execution that can be exploited in benchmark programs. in short: matrix multiplication of matrices with the same dimensions, but with different values, take varying amounts of time.

one subject can take 1000 seconds, another can take 2000+. this is with the exact same data size, just with different numbers.
 
Last edited:

broly

Suspended
Original poster
Apr 1, 2020
68
16
edmonton
You can use intel power gadget to observe clock speed and wattage. Could potentially be a clue.
looks like it didn't work with dual socket intel processors, but it lead me to the pcm project, which has some great information. i am going to ask them on github if something is wrong. thanks countryman
 

Elusi

macrumors regular
Oct 26, 2023
168
351
edit: i don't have geekbench. i run osx 10.14. i also am not sure if geekbench will do what i need it to do. please do not get hung up on synthetic benchmarks. when you're doing matrix computations there is some advantage, yes, to having avx and a newer architecture, but it doesn't scale the way you think.

similarly the key for my computations is the L2 and L3 hits, as there is little other benefit afforded by the speculative execution that can be exploited in benchmark programs. in short: matrix multiplication of matrices with the same dimensions, but with different values, take varying amounts of time.

one subject can take 1000 seconds, another can take 2000+. this is with the exact same data size, just with different numbers.
Me suggesting these benchmarks doesn't have much to do with comparing it straight to MATLAB performance. I'm saying that if you're having a hardware issue it should show on geekbench/cinebench results as well.

The simplest solution etc, my guess is still that something has changed with the MATLAB config and that you are doing a deep dive in the other end of the pool.
 

broly

Suspended
Original poster
Apr 1, 2020
68
16
edmonton
Me suggesting these benchmarks doesn't have much to do with compating it straight to MATLAB performance. I'm saying that if you're having a hardware issue it should show on geekbench/cinebench results as well.

The simplest solution etc, my guess is still that something has changed with the MATLAB config and that you are doing a deep dive in the other end of the pool.

i appreciate william of ockham, he was a good man.

but i haven't changed my matlab config in like 10 years man lol.

i have my command history from 2020 still. i don't touch the configuration settings because they work well out of the box.
 

m1maverick

macrumors 65816
Nov 22, 2020
1,315
1,238
i appreciate william of ockham, he was a good man.

but i haven't changed my matlab config in like 10 years man lol.

i have my command history from 2020 still. i don't touch the configuration settings because they work well out of the box.
Without having previous Matlab metrics to compare with then @Elusi suggestion is to find a benchmark, such as Geekbench / Cinebench, and run it on your system. Then compare those results with others who have the same 5,1 configuration. If your numbers are less than what others are getting then that would suggest a hardware issue. If you're getting similar results that would suggest a software issue (such as a change with Matlab...did it get silently updated? Maybe an OS update?). To run either benchmark would take a few minutes of your time.

As for your premise that you wore something out that is unlikely. Typically when there's a hardware issue it tends to cause operability problems (such as crashing, overheating, unable to do something). One thing that may be an issue is your hard drive is starting to fail. Does this Matlab work require a lot of disk activity while processing? Have you tried using Activity Monitor to check the resource utilization?

Finally, maybe someone with a similar configuration and access to Matlab could run your workload and compare? I'd offer but I don't have Matlab.
 

broly

Suspended
Original poster
Apr 1, 2020
68
16
edmonton
the IPC being <1 seems to be an issue, but i will defer to tsialex on this.

even in a dual socket configuration, i assume an IPC of 1 is what it should be. especially when the hits are reasonably good for an optimisation program.

i am also not getting the full turbo boost of 3.73 but maybe it only goes halfway (3.46 + 13/14 = 3.59~3.60, which what i'm getting).
 

tsialex

Contributor
Jun 13, 2016
13,048
13,272
the IPC being <1 seems to be an issue, but i will defer to tsialex on this.

even in a dual socket configuration, i assume an IPC of 1 is what it should be. especially when the hits are reasonably good for an optimisation program.

Nope, not all instructions can be executed in one cycle of clock, some take several cycles and this changes according the workload, latency, cache hit/miss ratio and etc. For example, some instruction access memory addresses that resides in another CPU memory controller. Also some SIMD instructions payload take several cycles to run.

Only very simple instructions have an IPC near 1.

i am also not getting the full turbo boost of 3.73 but maybe it only goes halfway (3.46 + 13/14 = 3.59~3.60, which what i'm getting).

Turbo boost depends on core utilization and temperatures, you only have full Turbo if you are using fewer cores and the die can spread the heat generated. Intel have a very good paper on this topic.

All modern Intel CPUs have varying maximum turbo ratios depending on the number of active (not halted or in a sleep state).
 
  • Like
Reactions: broly

broly

Suspended
Original poster
Apr 1, 2020
68
16
edmonton
Nope, not all instructions can be executed in one cycle of clock, some take several cycles and this changes according the workload, latency, cache hit/miss ratio and etc. For example, some instruction access memory addresses that resides in another CPU memory controller. Also some SIMD instructions payload take several cycles to run.

Only very simple instructions have an IPC near 1.


Turbo boost depends on core utilization and temperatures, you only have full Turbo if you are using fewer cores and the die can spread the heat generated. Intel have a very good paper on this topic.

All modern Intel CPUs have varying maximum turbo ratios depending on the number of active (not halted or in a sleep state).
right you are, my man.

i ran intel's pcm on my macbook to get the metrics, and they're similar to what the big box is spitting out.

i'm kind of surprised it's only at 3.40ghz in turbo mode. was hoping it'd go far higher ;P

the write and read metrics are way higher though. i don't think this is entirely explained by the differences in memory speed (??)
mwe3.gif
 

tsialex

Contributor
Jun 13, 2016
13,048
13,272
i don't think this is entirely explained by the differences in memory speed (??) View attachment 2373188

It's not just the memory running at a much greater frequency, but memory bandwidth/latency/buffering/ECC. LPDDR-5 performance let DDR-3 RDIMMs in shame, 51,2GB/s versus 10,6GB/s.

Also, the bigger L2/L3 caches, make a big difference.
 
  • Wow
Reactions: _Mitchan1999

broly

Suspended
Original poster
Apr 1, 2020
68
16
edmonton
hahahhahahaha the way you describe it is almost like saying "this isn't surprising" but i'm telling you man i didn't experience the kind of thing until recently

here's the big box:
Screen Shot 2024-04-29 at 7.06.07 PM.png

same data, same everything, macbook:
Screen Shot 2024-04-29 at 7.07.09 PM.png


there is no way this is right :p

let me try another dataset.
 
Last edited:

Brandon42

macrumors regular
Jul 24, 2019
189
572
oh they do, i just didn't use 'tall' to see it because i had all the memory banks reporting temperatures. completely forgot about that :p had to disable them.


here you go


everything looks good, right?
The power supply seems quite hot and yet the power supply fan is at idle. This is a bit of a stretch, but is it possible the power supply fan has failed and the system is limiting the power consumption due to power supply temps?
 

broly

Suspended
Original poster
Apr 1, 2020
68
16
edmonton
The power supply seems quite hot and yet the power supply fan is at idle. This is a bit of a stretch, but is it possible the power supply fan has failed and the system is limiting the power consumption due to power supply temps?

this is a good guess in my opinion.

i checked the temps and stats again, and it's 75 degrees and the fan is only spinning at 600 RPM.

i've had difficulty pulling the voltage/power draw for this machine. the intel gadget doesn't work for "dual cpu package" and the intel pcm evolution does not show power draw for dual sockets. but it could be something like that, yes.

the counter argument would be: well the CPUs are getting some turbo (not all), but i do feel like something is stopping them from going full bore. i remember the fans were much louder at this same load.

i'm not sure how the PSU fan is supposed to behave.

edit: even higher now :/
Screen Shot 2024-04-30 at 11.15.27 AM.png


is this normal, or "within spec", tsialex?
 
Last edited:

casperes1996

macrumors 604
Jan 26, 2014
7,483
5,644
Horsens, Denmark
i've had difficulty pulling the voltage/power draw for this machine. the intel gadget doesn't work for "dual cpu package" and the intel pcm evolution does not show power draw for dual sockets. but it could be something like that, yes.
Try the program stats. Free open source. Very good.
 
  • Like
Reactions: broly
Register on MacRumors! This sidebar will go away, and you'll see fewer ads.