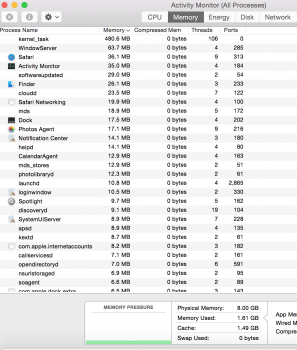
I purchased a 2015 13" Retina Macbook Pro last week. Last night I checked my Activity Monitor and noticed kernel_task was over 600MB w/100+ threads. The Memory Used was around 2GB. I did some research and found a wide range of suggestions and possible causes but I wanted to share this here to see if you guys think this is an issue I should have a Genius look at. The only thing I had open when I got those numbers is Safari and Activity Monitor. Nothing else was plugged in, Bluetooth is off and I deleted the couple new apps I downloaded from the App store. I restarted before I went to bed last night. This morning when I checked that kernel_task was around 450 and the thread count was 106. However the big difference was the "Swap Used" which was around 6GB, last night it remained at zero. This is with no applications open (other than Activity Monitor). So I restarted again and took the attached photo of my numbers. Swap Used was back to zero and Memory Used dropped slightly but I'm still concerned that my kernel task and it's thread is unusually high so I wanted to see if anyone else is having a similar issue or recommends I take it to a Genius?


