Become a MacRumors Supporter for $50/year with no ads, ability to filter front page stories, and private forums.
His CPU could be using more power because, as you stated, you use your dGPU full time at the adapter is only 85 watts. I would try it with your dGPU off. this makes the temps way worse.

Yup. I am running the tests now... I am definitely seeing more turbo boost with the Nvidia GPU off, but temps seem pretty similar. I still don't get the speeds he is getting. Anyway, once it is done, I'll create a couple of graphs to compare the two runs properly.
 
I've done a little experimenting myself, and I've managed to get closer to the results which you've provided.

The fact of having discrete graphics locked on (with GfxCardstatus) strongly influences the result when you are using the trackpad. When I encoded a video with integrated graphics, I noticed that was able to move around the GUI without affecting the processor frequency too much. But if you switch on discrete graphics and start doing GUI gestures at the same time, the processor frequency drops dramatically. As soon as you stop the gestures, the values will return to whatever they were before. It also seems that the results strongly depend on what type of source material you're trying to encode. I'm sure if we both use the same source material, settings, and environment, we will probably end up with similar results.

BTW, I found the data logged by Intel Power Gadget to be quite interesting as you can see the Power draw, Temperature, and CPU frequency. I never realized we had this tool on the Mac. I'll try and run some tests later and provide the data.
 
Last edited:
Yup. I am running the tests now... I am definitely seeing more turbo boost with the Nvidia GPU off, but temps seem pretty similar. I still don't get the speeds he is getting. Anyway, once it is done, I'll create a couple of graphs to compare the two runs properly.

When I get some time in a few days, I'll do some tests using your same methods. I've redone the thermal compound on mine. In previous tests, my results have been nearly as good as Doward's (I didn't take the extra steps to lap like he did, but I still get sustained TurboBoost).

I'm very much enjoying the discussion generated in this thread so far. I'm not even sure why there have to be two different "camps" on this issue. But I hope we can continue to keep the debate out of this particular thread in favor of collecting some data. So far, I've seen a few things that contradict my expectations. I very much enjoy that too.
 
I'm very much enjoying the discussion generated in this thread so far. I'm not even sure why there have to be two different "camps" on this issue. But I hope we can continue to keep the debate out of this particular thread in favor of collecting some data. So far, I've seen a few things that contradict my expectations. I very much enjoy that too.

I'm with you on these points. Where things go off the rails is when opinions, conjecture, and normative claims get inserted. This thread and the work done in it is awesome because it avoids that.
 
Look, I think you did excellent empirical work in your thread, but I'm still not seeing any evidence to support this claim. Is there anything tangible you can provide here, or is this really just speculation?

No, this is basic engineering. It's well known in any discipline that you give yourself 15-20% headroom vs max.

Steve Somers, VP of Engineering for Extron Electronics has a nice article regarding this:
Thermal Management Part 1: How Hot Is Too Hot?

These are basic laws of thermodynamics. I'm not understanding how there is even a debate here?
 
I've done a little experimenting myself, and I've managed to get closer to the results which you've provided.

The fact of having discrete graphics locked on (with GfxCardstatus) strongly influences the result when you are using the trackpad. When I encoded a video with integrated graphics, I noticed that was able to move around the GUI without affecting the processor frequency too much. But if you switch on discrete graphics and start doing GUI gestures at the same time, the processor frequency drops dramatically. As soon as you stop the gestures, the values will return to whatever they were before. It also seems that the results strongly depend on what type of source material you're trying to encode. I'm sure if we both use the same source material, settings, and environment, we will probably end up with similar results.

BTW, I found the data logged by Intel Power Gadget to be quite interesting as you can see the Power draw, Temperature, and CPU frequency. I never realized we had this tool on the Mac. I'll try and run some tests later and provide the data.

Thanks for reporting back. The tool is great as it allows us to look at this interesting issue from an empirical point of view. I am also seeing that the source material makes a small difference with Handbrake, regardless of thermal headroom.

I suspect that the only way to ensure that we are comparing apples to apples is to make sure that we generate the load in the same way.

The easiest way to achieve that is by running this in 4 terminal windows

Code:
yes > /dev/null
 
I've tried to produce throttling with Handbrake and have more or less failed. I encoded 4 videos for an hour, but no success in reproducing what theSeb showed. I'm definitely capable of producing throttling running various programs together and playing with the GUI gestures. But a basic encoding job doesn't do it. So I haven't found a method where I can explain to another person "this is how you do it".

The data for Intel Power Gadget and the pmset thermlog is here:

http://www.sendspace.com/file/vm730l

I produced a quick and dirty graph below which shows that CPU frequency didn't drop below 3 Ghz at any point during the test. The spikes towards the bottom are when the machine was idle (e.g. Handbrake loading next movie in queue).

I suspect that the key here is the source files. I used some 1080p videos and re-encoded them. I tried different settings in Handbrake, but no luck.

I am currently running 4 yes > /dev/null shells along with an encoding job, but no luck yet. I'm confronted with a 3.20 Ghz flatline.

Maybe someone else should have a go at it. :confused:
 

Attachments

  • cpu-graph-private.png
    cpu-graph-private.png
    187.1 KB · Views: 186
You should consider rendering a complex after affects scene (e.g., just generate multiple layers of fractals). You can download a trial of AE CC and test it yourself in minutes.
 
It's a great discussion going on here. What I think the problem with achieving throttling is that there's no OS X app that is as CPU intensive as Prime95 blend test with Furmark GPU stress test running at the same time. I'm pretty sure you'll easily obtain CPU throttling in Bootcamp than OS X.

Correct me if I'm wrong, but I don't think video encoding with Handbrake can push the CPU to it's absolute maximum power draw and heat output compared to Prime95 since Prime95 does a lot more to squeeze every power and heat out a CPU. You can read more about how prime95 does its stress testing here: http://en.wikipedia.org/wiki/Prime95#Use_for_stress_testing
 
No, this is basic engineering. It's well known in any discipline that you give yourself 15-20% headroom vs max.

Steve Somers, VP of Engineering for Extron Electronics has a nice article regarding this:
Thermal Management Part 1: How Hot Is Too Hot?

These are basic laws of thermodynamics. I'm not understanding how there is even a debate here?

Check this out:

Thermo Thermal-Management Rule of Thumb #1: No component should be so hot as to preclude the indefinite placement of a human finger thereon.

I wonder if anyone can place their fingers near the heat vent of a rMBP while it's actually in use (e.g., performing video renders in AE). ...I don't think so.
 
Check this out:


I wonder if anyone can place their fingers near the heat vent of a rMBP while it's actually in use (e.g., performing video renders in AE). ...I don't think so.

I am doing it right now and it does not feel particularly hot. I don't get your point or the point of the quote. It seems a bit silly to me. Should I check how if my car is overheating by touching the sump? No, that would be a stupid thing to do.

----------

I've tried to produce throttling with Handbrake and have more or less failed. I encoded 4 videos for an hour, but no success in reproducing what theSeb showed. I'm definitely capable of producing throttling running various programs together and playing with the GUI gestures. But a basic encoding job doesn't do it. So I haven't found a method where I can explain to another person "this is how you do it".

The data for Intel Power Gadget and the pmset thermlog is here:

http://www.sendspace.com/file/vm730l

I produced a quick and dirty graph below which shows that CPU frequency didn't drop below 3 Ghz at any point during the test. The spikes towards the bottom are when the machine was idle (e.g. Handbrake loading next movie in queue).

I suspect that the key here is the source files. I used some 1080p videos and re-encoded them. I tried different settings in Handbrake, but no luck.

I am currently running 4 yes > /dev/null shells along with an encoding job, but no luck yet. I'm confronted with a 3.20 Ghz flatline.

Maybe someone else should have a go at it. :confused:

The most interesting thing is that it looks as though your CPU is drawing more watts than mine, which would have an impact. I think thermal paste application variances are the only way to explain what we're seeing at this point in time.
 
No, this is basic engineering. It's well known in any discipline that you give yourself 15-20% headroom vs max.

Steve Somers, VP of Engineering for Extron Electronics has a nice article regarding this:
Thermal Management Part 1: How Hot Is Too Hot?

These are basic laws of thermodynamics. I'm not understanding how there is even a debate here?

The problem, as I see it, is that you're assuming that the stated maximum is the actual maximum.

Put another way, imagine a graph with the y-axis being failure probability and the x-axis being mean temperature under load. That graph likely isn't linear, and the slope surely increases at high temperatures. But no one outside of Intel really knows how that slope is changing, or at what points it accelerates to a "bad" level.

There is no debate that cool is better than hot. There is no debate that Apple could cool their laptops better with non-crap thermal paste and non-crap application. Your thread was excellent in that matter, and I've cited it before.

Where there is debate is whether the 100 degree C temperature (105 degrees on Ivy Bridge models) is close to one of those pseudo-inflection points. And unfortunately, unless there's a spec document that I haven't seen, it's a debate we can't resolve...but as a result, it means that the claims of neither side can be validated. Your link, while interesting, starts to get there, but doesn't go to the level that I'm talking here. Note the specific language that I find interesting and that's perfectly compatible with the viewpoint opposite yours:

Junction temperatures range typically from about 100°C to 150°C.

That's why I'm honestly and curiously asking if you or anyone has seen a study they can link that indicates what that curve looks like—because without it, claims like "too hot" just don't fly.

So, you tell me: are we ultimately on the same page here?
 
The problem, as I see it, is that you're assuming that the stated maximum is the actual maximum.

So, you tell me: are we ultimately on the same page here?

In all points but this ;)

You're correct, *some* samples will run at a *somewhat* higher temperature than Intel's Tjunction(max). Intel's specification, however, is exactly as stated, and is what we have to work with.

Intel doesn't listed this parameter as Tjunction(recommended) - it's maximum. Hard limit parameter as far as design is concerned.

You are correct, however, as designing, testing, and confirming Tjunction(max) specifically with Foxconn's manufacturing, specifically with Apple's design, would be a multi-million dollar experiment. We would need hundreds of MBPs, thousands of man hours, and a decent bit of equipment to test this throughly.

Intel's done that leg work for us. That's why we have (and follow) the published specification.

AirThis, you need to heavily load the GPU and CPU together to limit throttling. I ran 8 'yes >/dev/null' threads + encoding under FCPX yielded me almost 60 watts of CPU power!

Interestingly enough, my pmset data bounced from 94-97% and then went to 100%, but dropped the speed to 2.8Ghz on me. Considering that is still 300Mhz over stock 2.5Ghz - I'm happy ;)
 
Intel doesn't listed this parameter as Tjunction(recommended) - it's maximum. Hard limit parameter as far as design is concerned.
...
Intel's done that leg work for us. That's why we have (and follow) the published specification.

But, it's only a maximum as far as what they state to manufacturers. You're absolutely correct that manufacturers accordingly follow that published spec. But that isn't tantamount to meaning that prolonged use at that maximum is harmful. If it were, then Intel would be putting itself in jeopardy in today's litigation-and-liability driven environment.

We can agree that cooler is better, that throttling takes place at Tjunction, that better cooling systems mean better performance (by delaying throttling), and that exceeding the stated maximum would be VeryBad(TM). The only thing separating us, as I see it, is the question of whether extended use at or near the TJmax temperatures has a statistically significant impact on product lifespan versus, say, running 5-10 degrees cooler. If someone can produce some empirical evidence on this, I would be more than happy to jump on board with your final conclusion. :)

Barring that, though, I'll let this discussion die, because I'd like to avoid letting another thread derail—especially a good one like this.
 
Barring that, though, I'll let this discussion die, because I'd like to avoid letting another thread derail—especially a good one like this.

No problem, and agreed. I'll see what i can find, and PM you links to what I find. :)
 
Has someone done the same tests on the late 2013 model? It seems much better at cooling/not throttling than the mid 2012 model was?

Apologies for the dramatic title, but I have always found this to be an interesting topic. A week does not go by without a topic created by a concerned owner seeing his Macbook Pro hitting around 100 degrees Celsius under load, which is pretty much the max operating temperature, as set by Intel.

There are two camps that always reply in these threads. One says that it is ok, since the CPU is designed to handle these temperatures and as long as it does not shutdown, the Mac is not overheating. The other camp says that running so close to maximum operating temperature could impact reliability and also performance.

I have been fascinated by the discussion, but wanted to bring something tangible and empirical to the table. I have in the past tried to find ways to be able to see the current CPU clock rate in OS X, with various forms of success. By installing kexts and using FreeSMC with plugins, I managed to do this on some older Macs, like my 2011 MBA, but trying the same technique would cause the rMBP to crash. I then recently discovered a very handy little tool - Intel Power Gadget. Do note if you run it yourself, then watching it does not give the most accurate results. It is advisable to use the output to a file functionality of the tool instead.


In addition, I have been aware of the pmset terminal command, however I never really spent much time looking at the output properly until now.

Code:
pmset -g thermlog

The output when the CPU is “idle"
Code:
Note: No thermal warning level has been recorded
24/12/2013 17:41:54 GMT  CPU Power notify
CPU_Scheduler_Limit  = 100
CPU_Available_CPUs  = 8

CPU_Speed_Limit  = 100

Keep the window open and run a CPU intensive application, like Handbrake. You will see notifications popping up like

Code:
24/12/2013 13:52:53 GMT       CPU_Scheduler_Limit      = 100
     CPU_Available_CPUs      = 8
     CPU_Speed_Limit      = 85

I found this interesting and wanted to see if there is a simple formula to work out the clock rate using CPU_Speed_Limit. I found that it was as simple as it could be. If we assume that CPU_Speed_Limit is just the percentage, we can work out the current clock rate

I ran a Handbrake encode and piped pmset -g thermlog output to a file. I also enabled logging from Intel Power Gadget. I then analysed both logs and correlated the events.

In the case of a workload taxing all 4 physical cores 100% CPU should be 3.4 GHz (Turbo boost on this CPU is 0.8 GHz with 4 cores active)


I confirmed that the formula works by checking a couple of data points against the output from Intel Power Gadget

Code:
24/12/2013 13:52:55 GMT       CPU_Scheduler_Limit      = 100
     CPU_Available_CPUs      = 8
     CPU_Speed_Limit      = 82

3.4 x 0.82 = 2.788 (rounded up = 2.8 GHz) which corresponds to the log from Intel Power Gadget.

Then we see this

Code:
24/12/2013 13:52:56 GMT       CPU_Scheduler_Limit      = 100
     CPU_Available_CPUs      = 8
     CPU_Speed_Limit      = 85

3.4 x 0.85 = 2.89 (rounded up to 2.9 GHz)

So at 13:52:56 we expect to see a change from 2.8 to 2.9, which we do

Code:
13:52:56:110     2800
13:52:56:160     2800
13:52:56:209     2800
13:52:56:259     2800
13:52:56:310     2900
13:52:56:360     2900
13:52:56:410     2900
13:52:56:460     2900
13:52:56:510     2900
13:52:56:560     2900
13:52:56:610     2900
13:52:56:659     2900

Then from this point until 13:52:59 it ran at 2.9 GHz according to Intel Power Gadget. Correspondingly there were no events in pmset until this

Code:
24/12/2013 13:52:59 GMT       CPU_Scheduler_Limit      = 100
     CPU_Available_CPUs      = 8
     CPU_Speed_Limit      = 88

So calculating what to expect in Intel Power Gadget

3.4 x 0.88 = 2.992 (rounded up 3 GHz)

Here is the corresponding Intel Power Gadget log

Code:
13:52:59:760     2900
13:52:59:810     2900
13:52:59:859     2900
13:52:59:909     3000
13:52:59:959     3000
13:53:00:010     3000

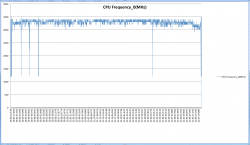
So what happened during the test?

Image

The Handbrake encode had 3 different clips in the queue. For the purposes of average/min/max I removed the statistics when one encode finished and the next started to not skew the data (you can see those stop/start events in the chart above clearly)

Encode 1
Code:
Average Frequency (MHz) 2859 
Max Frequency (MHz) 3300 
Min Frequency (MHz) 2600 
Average Temperature (Celsius) 101 
Max Temperature (Celsius) 105 
Min Temperature (Celsius) 89

Encode 2
Code:
Average Frequency (MHz) 2727 
Max Frequency (MHz) 2800 
Min Frequency (MHz) 2500 
Average Temperature (Celsius) 101 
Max Temperature (Celsius) 104 
Min Temperature (Celsius) 96

Encode 3
Code:
Average Frequency (MHz) 2678 
Max Frequency (MHz) 2800 
Min Frequency (MHz) 2500 
Average Temperature (Celsius) 101 
Max Temperature (Celsius) 105 
Min Temperature (Celsius) 96

We see the average frequency going down over time. Max clock rate (3.4) was only hit right at the beginning of an encode and those data points were deleted, as I mentioned already

Conclusions

In the past Apple has sometimes run CPUs at lower than base clock to reduce internal temperatures (all the time). Intel makes no guarantees about turbo boost - in other words, you should expect at least a minimum of the base clock rate under load, which is what we mostly see in this experiment. Thermal throttling does happen, but even on a thermally constrained laptop, we only see this happening very seldom and only up to a small number below the base clock rate.

The operating system believes that everything was running fine with no abnormal temperatures recored, even though we were hitting 100-105 degrees Celsius. Pmset confirms this:

Code:
Note: No thermal warning level has been recorded

It is possible that with better cooling Turbo Boost could be sustained for longer periods.

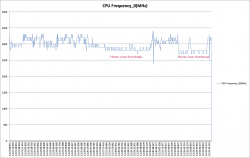
A side note about Geekbench

Armed with all of these tools and knowledge we can look at benchmark applications, like Geekbench. It has become the most popular and often quoted benchmark on these forums. People use it for various arguments. Intel has been concentrating a lot on the performance of the mobile CPUs and has, arguably, been ignoring the desktop performance. We see this trend in Geekbench, with Mobile CPUs in the Macbook Pros snapping at the heals of the top of the range iMac and the iMac snapping at the heal of the Mac Pros. However, as I have always said Geekbench is a sprint and shows mainly how fast the CPU is with maximum Intel Turbo Boost. It does not show how well the system will perform in real use.

The problem is that pmset -g thermlog clearly shows that when we run Geekbench, we receive no events, therefore the CPU is running at 100% during this time with no speed limit. Geekbench’s workload is simply not strenuous enough to see the impact of thermal throttling and makes comparisons skewed towards CPUs with the maximum Turbo Boost clock rate. Basing purchasing decisions on this is not a good idea in my opinion.

I have the mid 2012 rmbp and I can verify for what MacSumo said that the number row area gets hot to the touch. though the keys does not get hot to the touch but the aluminum gets very hot and feel quite warm when hovering my fingers above the humber keys area.
 
I have a late 2013 with i7-4850HQ base 2.3 GHz and 3.5 GHz Turbo.

I have been running Handbrake now for over 30 minutes and the Intel Power Gadget is fluctuating between 3.0 and 3.1 GHz.

Code:
pmset -g thermlog
Note: No thermal warning level has been recorded

27/12/13 11:32:11 GMT+2  CPU Power notify
	CPU_Scheduler_Limit 	= 100
	CPU_Available_CPUs 	= 8
	CPU_Speed_Limit 	= 88
27/12/13 11:32:12 GMT+2  CPU Power notify
	CPU_Scheduler_Limit 	= 100
	CPU_Available_CPUs 	= 8
	CPU_Speed_Limit 	= 85
27/12/13 11:32:20 GMT+2  CPU Power notify
	CPU_Scheduler_Limit 	= 100
	CPU_Available_CPUs 	= 8
	CPU_Speed_Limit 	= 88
27/12/13 11:32:22 GMT+2  CPU Power notify
	CPU_Scheduler_Limit 	= 100
	CPU_Available_CPUs 	= 8
	CPU_Speed_Limit 	= 85
27/12/13 11:32:25 GMT+2  CPU Power notify
	CPU_Scheduler_Limit 	= 100
	CPU_Available_CPUs 	= 8
	CPU_Speed_Limit 	= 88
27/12/13 11:32:27 GMT+2  CPU Power notify
	CPU_Scheduler_Limit 	= 100
	CPU_Available_CPUs 	= 8
	CPU_Speed_Limit 	= 85
27/12/13 11:32:29 GMT+2  CPU Power notify
	CPU_Scheduler_Limit 	= 100
	CPU_Available_CPUs 	= 8
	CPU_Speed_Limit 	= 88
27/12/13 11:32:30 GMT+2  CPU Power notify
	CPU_Scheduler_Limit 	= 100
	CPU_Available_CPUs 	= 8
	CPU_Speed_Limit 	= 85
27/12/13 11:32:34 GMT+2  CPU Power notify
	CPU_Scheduler_Limit 	= 100
	CPU_Available_CPUs 	= 8
	CPU_Speed_Limit 	= 88
27/12/13 11:32:36 GMT+2  CPU Power notify
	CPU_Scheduler_Limit 	= 100
	CPU_Available_CPUs 	= 8
	CPU_Speed_Limit 	= 85
27/12/13 11:32:41 GMT+2  CPU Power notify
	CPU_Scheduler_Limit 	= 100
	CPU_Available_CPUs 	= 8
	CPU_Speed_Limit 	= 88
27/12/13 11:32:43 GMT+2  CPU Power notify
	CPU_Scheduler_Limit 	= 100
	CPU_Available_CPUs 	= 8
	CPU_Speed_Limit 	= 85
27/12/13 11:32:45 GMT+2  CPU Power notify
	CPU_Scheduler_Limit 	= 100
	CPU_Available_CPUs 	= 8
	CPU_Speed_Limit 	= 88
27/12/13 11:32:46 GMT+2  CPU Power notify
	CPU_Scheduler_Limit 	= 100
	CPU_Available_CPUs 	= 8
	CPU_Speed_Limit 	= 85
27/12/13 11:32:53 GMT+2  CPU Power notify
	CPU_Scheduler_Limit 	= 100
	CPU_Available_CPUs 	= 8
	CPU_Speed_Limit 	= 88
27/12/13 11:32:54 GMT+2  CPU Power notify
	CPU_Scheduler_Limit 	= 100
	CPU_Available_CPUs 	= 8
	CPU_Speed_Limit 	= 85

I have just started to learn about the Intel Turbo Boost and it seems that on this CPU the maximum 3.5 GHz should only be used in single core use and the boost should be less when all 4 cores are stressed.

This 15" MBP seems to handle the heat OK and while the fans are blasting the exhaust is not hot and neither is the part between the hinge and the function keys.
 
OP what temps are you getting when disabling turboboost entirely?


gpu boost doesn't work in OSX at all right?
 
Ok, guys, I’ve played with this more and think I have found a “method” of getting it to throttle very regularly. Here’s my recipe:

- Fire up your favorite program to generate a lot of CPU activity, (Blender, fcpx, Handrake, etc) and let it run for 5 - 10 minutes.
- Open Activity Monitor to the CPU tab (so you can monitor effective CPU usage).
- Set your GPU to discrete graphics with gfxCardStatus (or similar).
- Open six windows in Chrome.
- Give each window its own space.
- Open a 4K video in the six chrome spaces. I used the following: http://www.youtube.com/watch?v=zFg_mlBFV2c
- Maximize all 6 videos to full screen.
- On your trackpad, push forward so as to reveal all your spaces as thumbnails.
- Hover over a thumbnail of the 4k video and keep your mouse there.

At this point, the CPU frequency will drop, although your CPU generating program will still keep on giving high CPU readings. It’s important to keep an eye on Activity Monitor, so that you can make sure your CPU usage remains high (otherwise the test would be flawed). It's also important to make sure that you are using a sufficient number of spaces so that the highlighted UI thumbnail becomes slightly larger when you hover over it.

I’ve made a quick graph below. In the first part of the Graph, I simply ran Blender (but also performing various UI gestures). In the 2nd part, I hovered over the UI thumbnails.

The Power Gadget logs can be found here:

http://www.sendspace.com/file/gsfm47
 

Attachments

  • Throttle-graph-private.png
    Throttle-graph-private.png
    166.9 KB · Views: 249
Last edited:
Yep, that's exactly what I've found on my late 2013 15 inch. It generates significantly less heat when performing the same tasks as my mid 2012 model used to.

It would be great if other people performed the same tests on their late 2013 model MacBook Pros.

I have a late 2013 with i7-4850HQ base 2.3 GHz and 3.5 GHz Turbo.


I have been running Handbrake now for over 30 minutes and the Intel Power Gadget is fluctuating between 3.0 and 3.1 GHz.


Code:
pmset -g thermlog

Note: No thermal warning level has been recorded


27/12/13 11:32:11 GMT+2  CPU Power notify

CPU_Scheduler_Limit = 100

CPU_Available_CPUs = 8

CPU_Speed_Limit = 88

27/12/13 11:32:12 GMT+2  CPU Power notify

CPU_Scheduler_Limit = 100

CPU_Available_CPUs = 8

CPU_Speed_Limit = 85

27/12/13 11:32:20 GMT+2  CPU Power notify

CPU_Scheduler_Limit = 100

CPU_Available_CPUs = 8

CPU_Speed_Limit = 88

27/12/13 11:32:22 GMT+2  CPU Power notify

CPU_Scheduler_Limit = 100

CPU_Available_CPUs = 8

CPU_Speed_Limit = 85

27/12/13 11:32:25 GMT+2  CPU Power notify

CPU_Scheduler_Limit = 100

CPU_Available_CPUs = 8

CPU_Speed_Limit = 88

27/12/13 11:32:27 GMT+2  CPU Power notify

CPU_Scheduler_Limit = 100

CPU_Available_CPUs = 8

CPU_Speed_Limit = 85

27/12/13 11:32:29 GMT+2  CPU Power notify

CPU_Scheduler_Limit = 100

CPU_Available_CPUs = 8

CPU_Speed_Limit = 88

27/12/13 11:32:30 GMT+2  CPU Power notify

CPU_Scheduler_Limit = 100

CPU_Available_CPUs = 8

CPU_Speed_Limit = 85

27/12/13 11:32:34 GMT+2  CPU Power notify

CPU_Scheduler_Limit = 100

CPU_Available_CPUs = 8

CPU_Speed_Limit = 88

27/12/13 11:32:36 GMT+2  CPU Power notify

CPU_Scheduler_Limit = 100

CPU_Available_CPUs = 8

CPU_Speed_Limit = 85

27/12/13 11:32:41 GMT+2  CPU Power notify

CPU_Scheduler_Limit = 100

CPU_Available_CPUs = 8

CPU_Speed_Limit = 88

27/12/13 11:32:43 GMT+2  CPU Power notify

CPU_Scheduler_Limit = 100

CPU_Available_CPUs = 8

CPU_Speed_Limit = 85

27/12/13 11:32:45 GMT+2  CPU Power notify

CPU_Scheduler_Limit = 100

CPU_Available_CPUs = 8

CPU_Speed_Limit = 88

27/12/13 11:32:46 GMT+2  CPU Power notify

CPU_Scheduler_Limit = 100

CPU_Available_CPUs = 8

CPU_Speed_Limit = 85

27/12/13 11:32:53 GMT+2  CPU Power notify

CPU_Scheduler_Limit = 100

CPU_Available_CPUs = 8

CPU_Speed_Limit = 88

27/12/13 11:32:54 GMT+2  CPU Power notify

CPU_Scheduler_Limit = 100

CPU_Available_CPUs = 8

CPU_Speed_Limit = 85


I have just started to learn about the Intel Turbo Boost and it seems that on this CPU the maximum 3.5 GHz should only be used in single core use and the boost should be less when all 4 cores are stressed.


This 15" MBP seems to handle the heat OK and while the fans are blasting the exhaust is not hot and neither is the part between the hinge and the function keys.


----------

Ok, guys, I’ve played with this more and think I have found a “method” of getting it to throttle very regularly. Here’s my recipe:

- Fire up your favorite program to generate a lot of CPU activity, (Blender, fcpx, Handrake, etc) and let it run for 5 - 10 minutes.
- Open Activity Monitor to the CPU tab (so you can monitor effective CPU usage).
- Set your GPU to discrete graphics with gfxCardStatus (or similar).
- Open six windows in Chrome.
- Give each window its own space.
- Open a 4K video in the six chrome spaces. I used the following: http://www.youtube.com/watch?v=zFg_mlBFV2c
- Maximize all 6 videos to full screen.
- On your trackpad, push forward so as to reveal all your spaces as thumbnails.
- Hover over a thumbnail of the 4k video and keep your mouse there.

At this point, the CPU frequency will drop, although your CPU generating program will still keep on giving high CPU readings. It’s important to keep an eye on Activity Monitor, so that you can make sure your CPU usage remains high (otherwise the test would be flawed). It's also important to make sure that you are using a sufficient number of spaces so that the highlighted UI thumbnail becomes slightly larger when you hover over it.

I’ve made a quick graph below. In the first part of the Graph, I simply ran Blender (but also performing various UI gestures). In the 2nd part, I hovered over the UI thumbnails.

The Power Gadget logs can be found here:

http://www.sendspace.com/file/gsfm47


What machine are you using? Also, what's the point of maximizing your CPU load in this way? Is this how you normally use your MacBook?
 
It seems the people posting here with 2013 Macbooks don't see the issues as much and that is a good sign.

The workload does matter as someone stated earlier on this page. Some benchmarks are not loading up the CPU as much as some others do. I am starting to this issue is only happening to people with Macbook PROS older than 2013. Any other Macbook including the all the Air models have this issue.
 
What machine are you using? Also, what's the point of maximizing your CPU load in this way? Is this how you normally use your MacBook?

I'm using the 2012 rmbp. For me the point of this is to get a better understanding of how/when my machine throttles, so as to avoid it.

The interesting thing here is that the OP and myself have gotten different results, but yet we have the same model. Many people have reported that their machine throttles, but I was not able to achieve that so easily. In the first tests which I ran, using Blender or Handbrake, I did not see much throttling. These are tasks which I do frequently with my computer. As for the last test, it's meaningful because it's the only method for me to achieve an equivalent result to that of the OP. Obviously, there are variables which we can't control (room temperature, OS used, software installed, etc.), but it's nevertheless noteworthy. I've joined the discussion in this thread because I've heard many people reporting of throttling problems with their rmbps, but their descriptions don't really seem to match my own personal experience. So I'm curious to know why other people don't achieve the same results as me. It's as plain and simple as that.

OK, I was asking because I was curious what year your machine was manufactured. It seems that the late 2013 models don’t throttle as easily as the 2012 models do.

I was also curious whether you normally play 6 simultaneous 4K videos while running Handbrake because it seems an unusual use of a computer.

It would be interesting to find out why you’re not seeing the same results as the OP and others are seeing with their 2012 models. This seems to suggest that their specific machines have some manufacturing defect (incorrect application of thermal paste?) and that throttling is not a routine problem that all 2012 machines have. What temperatures were you seeing when you were running your machine at max. load?

It may be unusual but so is running geekbench. Running handbreak and maybe playing back a couple files isn't artificial load in my book.
 
Register on MacRumors! This sidebar will go away, and you'll see fewer ads.