
Become a MacRumors Supporter for $50/year with no ads, ability to filter front page stories, and private forums.

nylock10

macrumors regular
Original poster
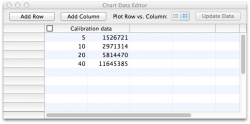
I made a graph with Pages (see attached pictures) and would like to show the exact values of my data on their respective axes. However, Pages automatically labels my axes with ranges (e.g., 2,500,000.00, 5,000,000.00, etc.) instead of the data values (e.g., 1,526,721.00 ...).

How can I get raw data values to appear on each axis?
 

Attachments

  • Screen Shot 2012-10-23 at 4.35.46 PM.png
    Screen Shot 2012-10-23 at 4.35.46 PM.png
    42.5 KB · Views: 138
  • Screen Shot 2012-10-23 at 4.35.56 PM.png
    Screen Shot 2012-10-23 at 4.35.56 PM.png
    33.4 KB · Views: 116
Register on MacRumors! This sidebar will go away, and you'll see fewer ads.