Hi all. There's been a large emphasis on the sequential read/write speeds of SSDs, but in many day-to-day usage patterns, the random read/write speeds are a better benchmark of performance. I'd like to make a chart summarizing all the different SSDs out there and available. But I need your help. Can those of you with SSDs run a benchmark and report the numbers here so that I can compile everything? Here are the steps:
1. Download Xbench 1.3 at http://www.xbench.com/.
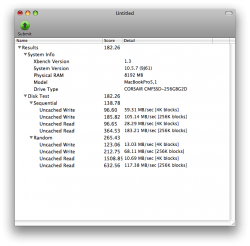
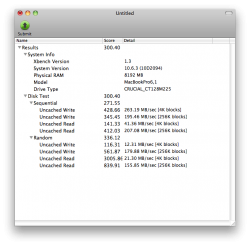
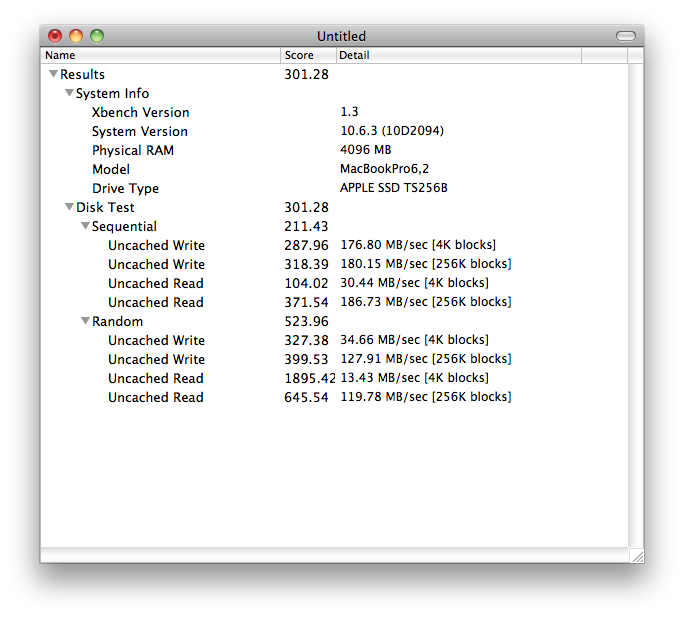
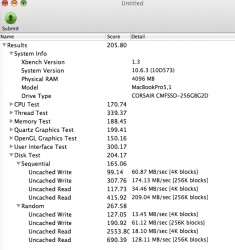
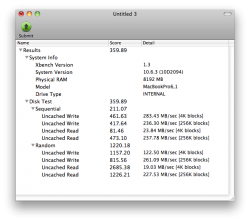
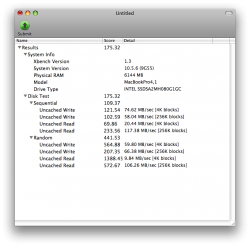
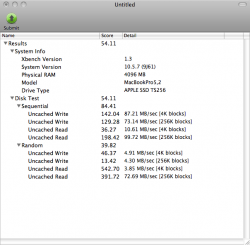
2. Open the program and run the "Disk Test" for your SSD drive.
3. Note the numbers under the Random test, for all four parameters of small and large writes and reads.
4. Repeat the test a second time to make sure that the numbers do not change. Accept the second test if the values are <10% different from the first test.
5. Screen capture the window by holding down command and shift and 4 and the spacebar. Click on the result window and that will save as a png file on the desktop; the default is Picture 1.png.
6. Report the values here with by attaching the screenshot of the result window. This will give us other needed information like computer and SSD model.
I realize that there are weaknesses to this survey. Xbench is only one benchmark. SSD speeds will vary based on usage. Etc. In the end, however, the variability should be sufficiently small that I think we'll be able to compare different SSDs well.
I'm going to get us started by posting my results with an Intel X-25M on a previous generation MacBook Pro. Ironically, my result will probably get thrown out because the SATA 1.5 GB interface actually limits the SSD read speed...
Thanks in advance!
1. Download Xbench 1.3 at http://www.xbench.com/.
2. Open the program and run the "Disk Test" for your SSD drive.
3. Note the numbers under the Random test, for all four parameters of small and large writes and reads.
4. Repeat the test a second time to make sure that the numbers do not change. Accept the second test if the values are <10% different from the first test.
5. Screen capture the window by holding down command and shift and 4 and the spacebar. Click on the result window and that will save as a png file on the desktop; the default is Picture 1.png.
6. Report the values here with by attaching the screenshot of the result window. This will give us other needed information like computer and SSD model.
I realize that there are weaknesses to this survey. Xbench is only one benchmark. SSD speeds will vary based on usage. Etc. In the end, however, the variability should be sufficiently small that I think we'll be able to compare different SSDs well.
I'm going to get us started by posting my results with an Intel X-25M on a previous generation MacBook Pro. Ironically, my result will probably get thrown out because the SATA 1.5 GB interface actually limits the SSD read speed...
Thanks in advance!


")