
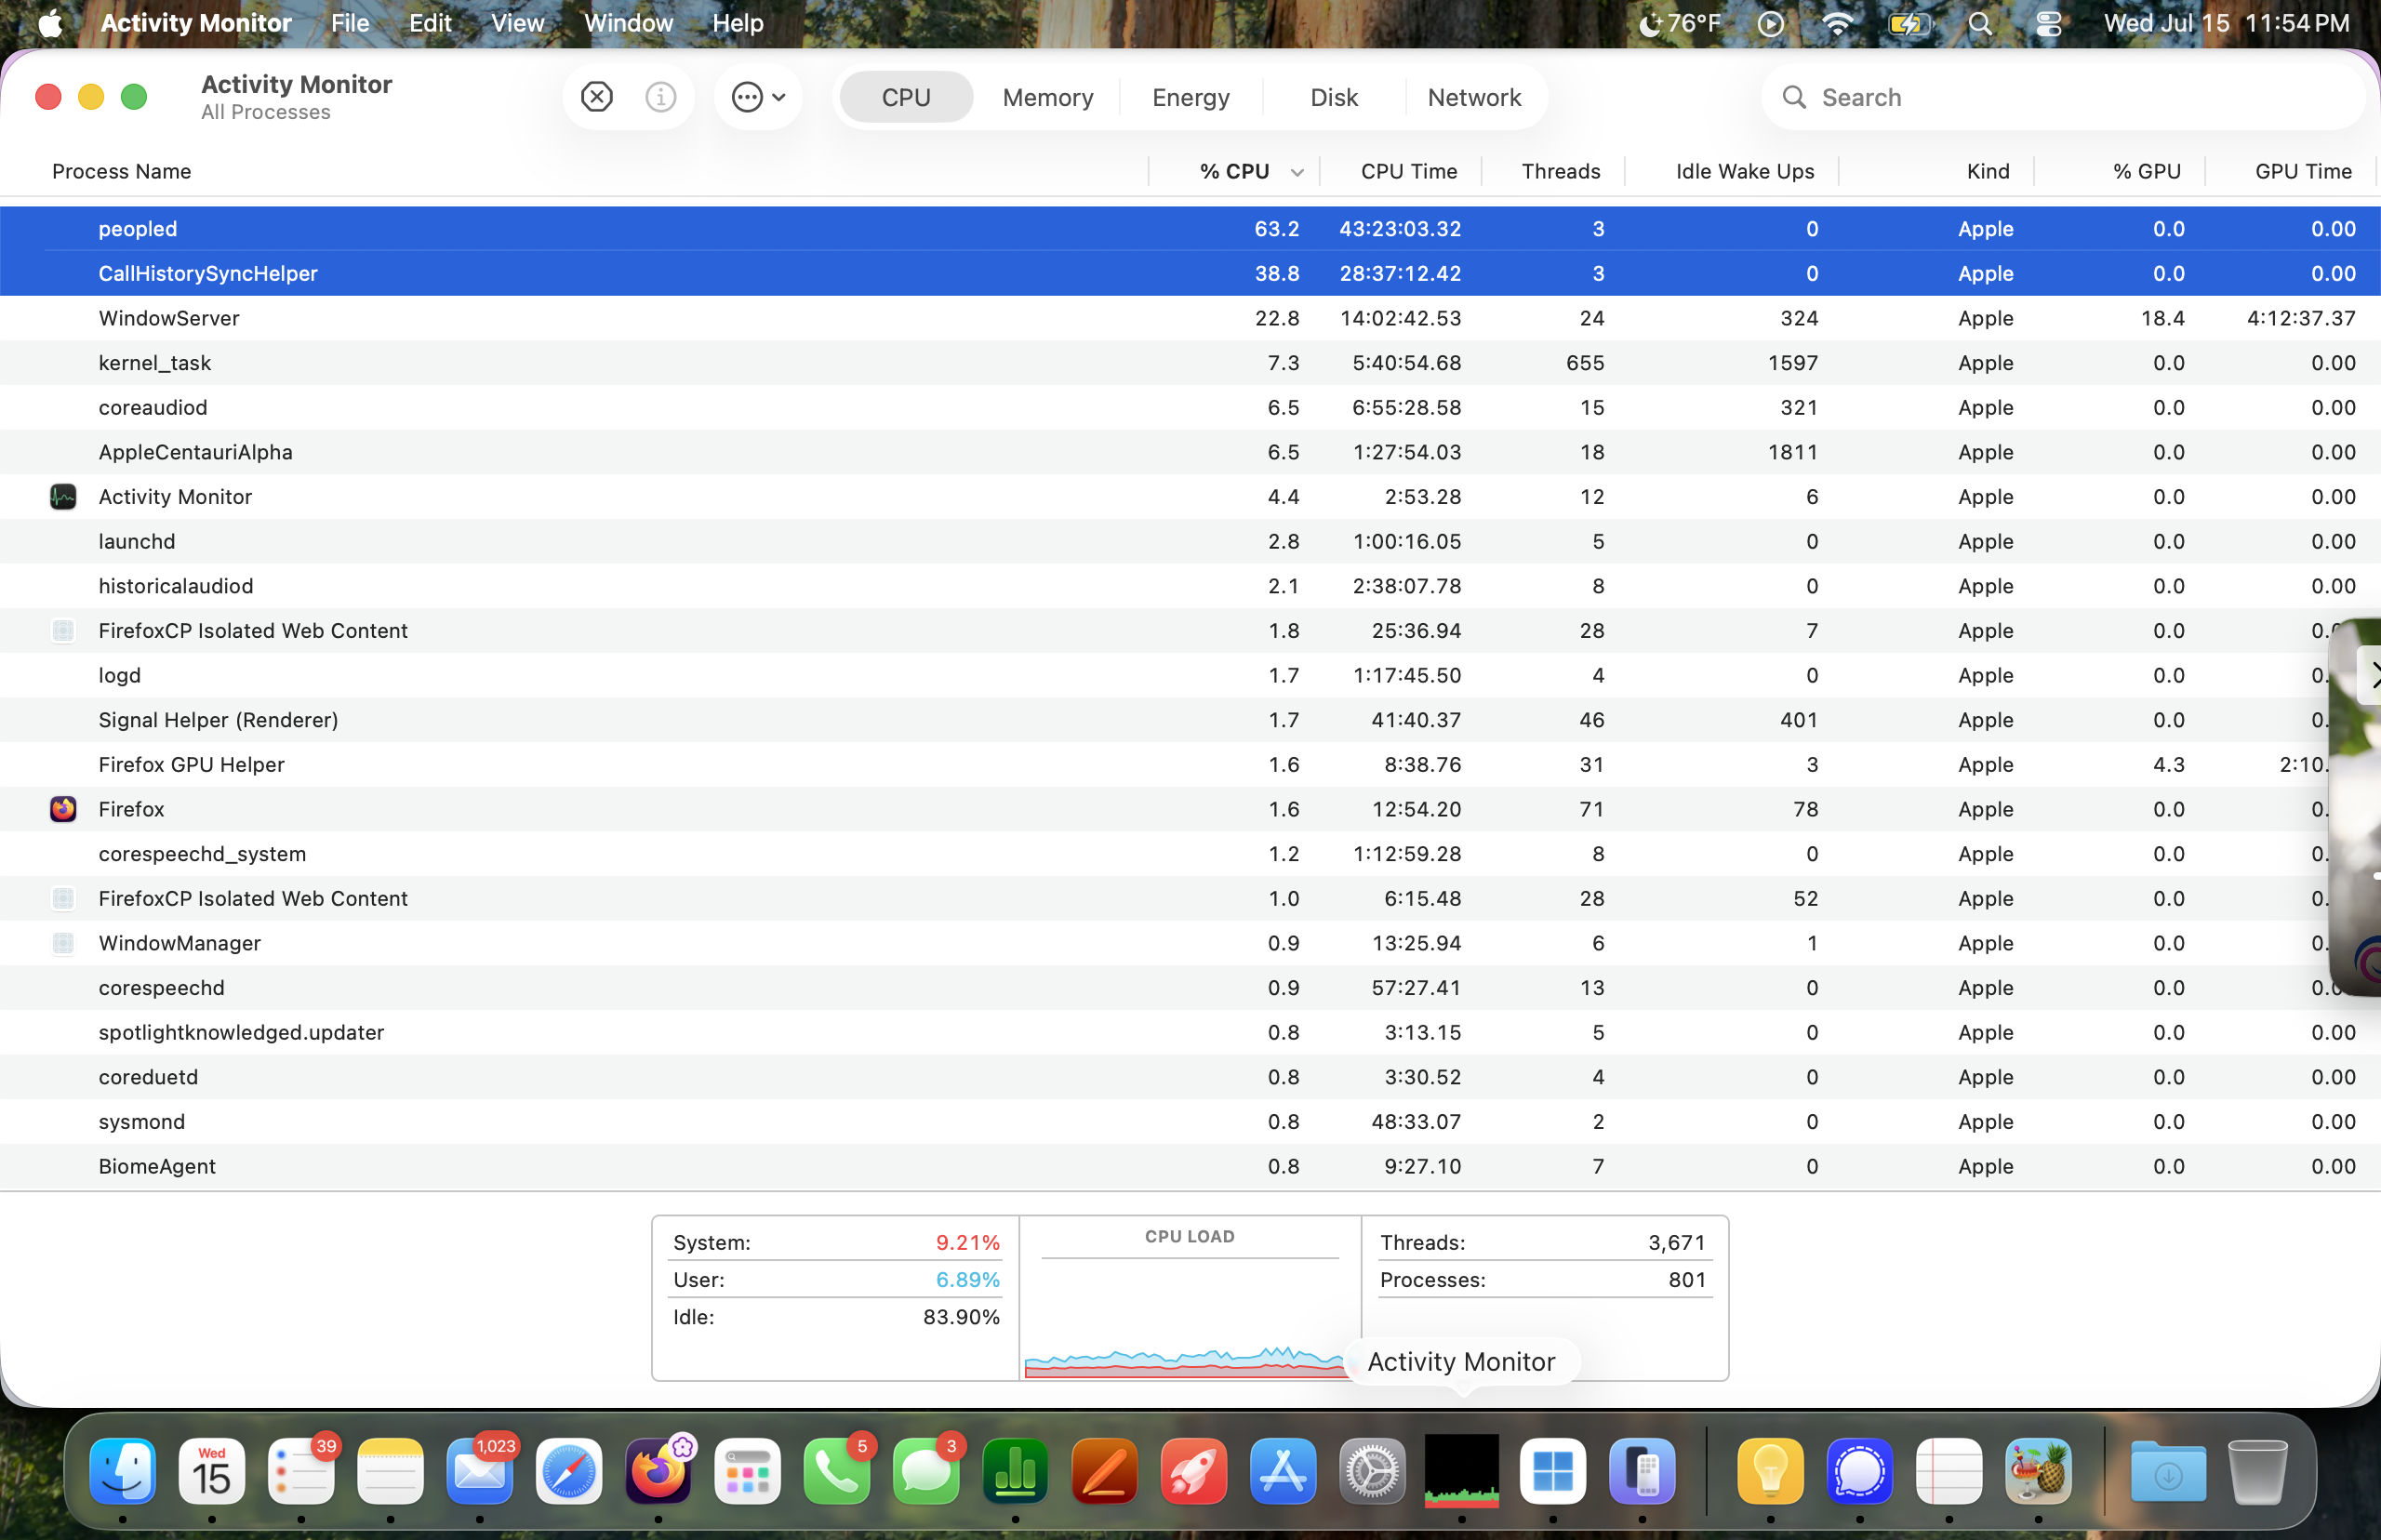
I looked up peopled, and I can guess what CallHistorySyncHelper does, but why do they always seem to be using so much CPU?
I just got an M5 MacBook Air...which, by the way, can handle handbrake at settings that are INSANE compared to my 2015 Windows PC. And I leave it in low power mode because it stays cooler!
But why does it always seem to be chewing up a full CPU (presumably an efficiency core) running those?
And also, my understanding is that the % CPU is the percent of one CPU, not for the whole system like Windows, but then at the bottom it lists what I'm guessing IS a 100%=the entire system?
I just got an M5 MacBook Air...which, by the way, can handle handbrake at settings that are INSANE compared to my 2015 Windows PC. And I leave it in low power mode because it stays cooler!
But why does it always seem to be chewing up a full CPU (presumably an efficiency core) running those?
And also, my understanding is that the % CPU is the percent of one CPU, not for the whole system like Windows, but then at the bottom it lists what I'm guessing IS a 100%=the entire system?
