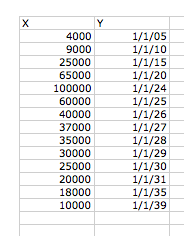
Yeah, im trying to make a simple line graph like someone else in another thread. I tried everything that other suggested. I have some years in one column starting B2 I labeled them 1/1/05 so it would recognize as a month and in A2 and down I have data corresponding to these dates. I just want a line graph, how do I do this, I hate the new excel 
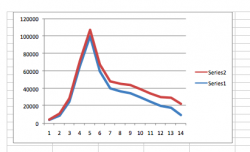
The graph is what I get when I click the little picture for a line graph......
the data is my data....
The graph is what I get when I click the little picture for a line graph......
the data is my data....